Which Marketing KPI is Most Important to Your Business?

Is one marketing KPI more important to your business than the rest?

This may not be an easy question to answer, but it’s one that you should address (if you have yet to do so).

Maybe you’re most interested in organic traffic. Or maybe social media is more your thing. Regardless, you need to understand which KPIs have the biggest impact on your business.

For those who have yet to answer this important question, here are several KPIs to keep an eye on:

1. Organic Traffic

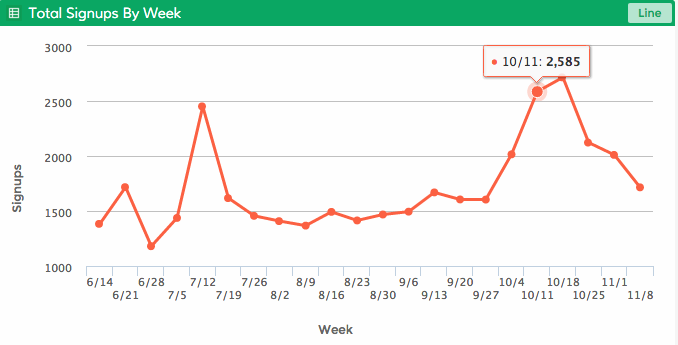
The primary goal of any business, as it relates to inbound marketing, is to generate as much organic traffic as possible.

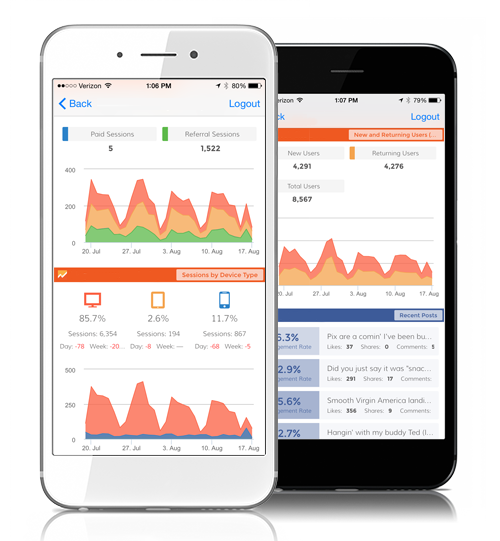
Tracking this means keeping a close watch on a bunch of things, such as:
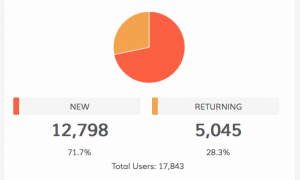
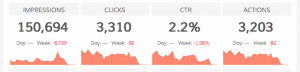
Screen Shot 2016-07-20 at 9.21.28 AM

  • Total traffic.
  • New and returning users.
  • Sessions by device type.
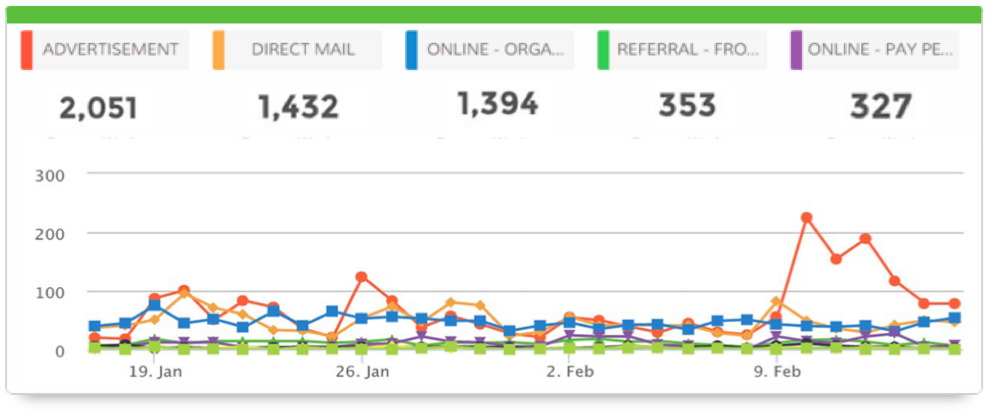
  • Top sources by medium.
  • Top pages.

This marketing KPI should never be overlooked.

2. Social Media

While some companies devote time, money, and resources to every available social media platform, others focus on the one or two that have the biggest impact on their business.

For example, Instagram continues to grow in popularity. If this social media platform is important to your business, you can track KPIs such as:

  • Number of followers.
  • Highest engagement.
  • Posts.

Tip: check out this article on Instagram KPIs to learn more.

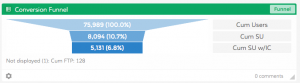
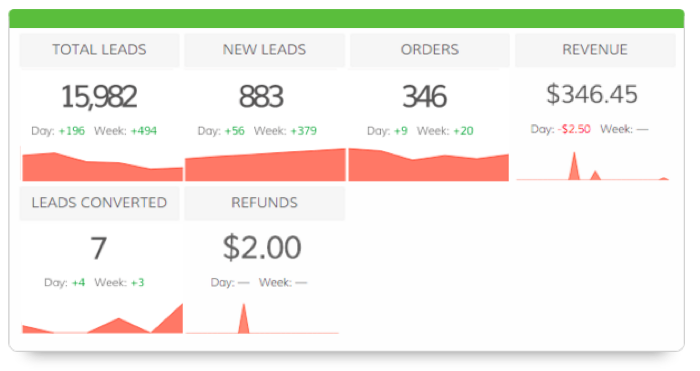
3. Sales Opportunities

Sales and marketing go together hand in hand, so it only makes sense to track KPIs associated with both areas of your business.

Is there anything better than seeing an increase in the number of sales opportunities in your pipeline?

This KPI should not be ignored, as it shows if your marketing strategy is generating the the results you’d expect.

In The End…

If you have yet to decide which marketing KPI is most important to your business, now’s the time to do so. There is a good chance that one of the three we discussed above will continue to impact your business well into the future.

P.S. Dasheroo can help you find and track every imaginable marketing KPI. Learn more and get started for free!

Track Our Startup: Exceeded Monthly KPIs + New Release on the Way

We’ve got a ton going on between all of the work our engineering team has been doing AND beating each KPI we track! Read on!

We’ve been busy trying to get release #27 out the door. If you remember it’s some new integrations with the likes of SendGrid and some new insights for Facebook Ads and a few other apps. Court and Nivi have been knee-deep in testing mode, great work guys. We’re hoping to get it out by next week so sit tight.

Dasheroo new UI for dashboards

Dasheroo’s new UI on the way soon!

I also can’t wait until we release our new UI. It’s super slick.
Josh has been working super closely with the awesome partner team at Zapier (that amazing company that gives you hundreds of metrics on your Dasheroo dashboard) posted a great blog post announcing our integration with them. They’ll be sending an email out to all of their hundreds of thousands of users soon.
We’re going to start working on a multi-stat insight for Google Sheets, a highly requested feature from our users, pretty cool huh? You’ll be able to compare one KPI to another all in one chart!
We’ve been at work behind the scenes on a stats refresh issue. Some of our customers are noticing that updates aren’t happening hourly but maybe ever few hours so we’re looking into all of our providers to make sure the problem isn’t widespread.
We made our monthly number, I should say numbers! We exceeded all of our KPIs: our new user KPI, our new paying customer KPI and our revenue KPI, and we couldn’t be happier. We shoot to increase our KPIs 10-15% each month and so far so good! More on KPIs.
On to June!

Track Our Startup: Officially Beating Our Numbers!

We have one more week of QA and bug fixing to go before we release what we call the mammoth release from hell. We’re shooting to be dev complete by end of the week and ideally target a launch for next week, but as we all know it totally depends on the QA findings. Get ’em Court! Oddly enough we’re also working on the next few releases but this one has to go out the order it was placed.

Dasheroo signupsWe got some killer mentions last week at Social Media Marketing World, that awesome event put on by Social Media Examiner. Thanks Chris Penn and Jen Newmeyer, you guys rock!

We’re are beating (and have continued to beat) our ‘New User’ KPI for the past 4 months and this month is no slouch! We are also doing great where users connect to a 3rd party application (like Google Analytics and Facebook) for our ‘engagement’ KPI this month. It’s great to get new users but having them be engaged with the product is what we’re really after. Most importantly we’re beating our revenue number for the past few months and with a freemium model that’s very cool.

We’re getting some great traction on Salesforce Appexchange installs as well, around 1-2 per day. That’s pretty good considering we don’t spend anything on marketing. If you don’t know about it, you can see your Dasheroo dashboards right within your Salesforce account. Pretty nifty.

We’re also having some pretty cool strategic meetings with bigger companies both from a partnership and customer perspective. We’ll tell you more when we can!

Gotta run, coffee time!

The Most Important KPI to Track: Revenue

Money, money, money. There is nothing more important to your business than revenue. It doesn’t matter which strategies you implement to boost revenue. What matters is that you are happy with this überly important KPI.

But let’s backtrack for a second. You can’t sit around and hope for the best. If you want to generate more revenue, it’s important to understand the steps you can take to make this happen.

Here is the million dollar question: what steps are you taking to reach your revenue goals?

Below are three KPIs to track, all of which will have an impact on your bottom line:

Screen Shot 2016-02-17 at 11.45.15 AM1. Website Traffic KPIs

Of course the more qualified traffic your website gets the greater chance you have of making a sale. When you combine increased traffic with a focus on conversion rate optimization, it won’t be long before you notice a positive impact on revenue. We wrote this article on how we increased our own conversion rates at Dasheroo.

Don’t get so caught up on the total number of visitors that you overlook other traffic metrics such as:

    • New users – You want to focus on “new” people that come to your site and watch if they’re converting to a sale.
    • Returning users – You want to keep this number constantly growing but your New Users should always be greater than returning users!
    • Top keywords – You should always keep an eye on your search engine optimization queries in Google Analytics to see where your position is and what keywords are getting people to your site.
    • Referral sources – If you see that a specific site you’ve been listed on is giving you quality traffic, you should reach out to the site owner to see what more you could be doing together. Obviously something it working.
    • Most visited pages – Make sure you optimize your most visited pages for conversion.

Screen Shot 2016-02-17 at 11.44.54 AM2. Conversions KPI

You can generate as much traffic as you want, but you won’t make any money if you aren’t converting visitors into buyers.

This is why it’s essential to fully understand your sales cycle. This can be accomplished through the implementation of a conversion funnel. With this data guiding you, you can tweak your sales process to generate more leads and close more deals.

At Dasheroo we just listed out all of the customer touch points whether it be via email or a person. Then we automated some of the manual work and brought our “days to pay” in a few days and our conversion rates increased!

Screen Shot 2016-02-17 at 11.48.29 AM3. Lead Generation KPI

Every purchase, regardless of size, starts with a lead. Some prospects will make an immediate purchase. Others, however, remain in your pipeline for an extended period of time.

Increasing revenue means generating more leads. It also means knowing the origin of your leads, cost of acquisition, and lead to sale ratio. We’ve got a ton of information on Sales KPIs.

By far, revenue is the most important KPI you can track. Just make sure you have a clear idea of which KPIs help you reach your revenue related goals. This is as simple as working backwards!

New Release! Infusionsoft CRM Analytics

This is by far our largest single integration with an app EVER! Bonus? We got help from the fine folks over at Infusionsoft to help with all of the KPIs we really need to be showing you in your Infusionsoft dashboard.

Infusionsoft OverviewDasheroo's Infustionsoft CRM: overview dashboard

The overview insight for Infusionsoft acts as a mini dashboard giving you a quick overview of the different high level insights
from your Infusionsoft account. This insight includes the following metrics:

  • Total leads
  • New leads
  • # of leads converted
  • # of orders
  • Total Revenue
  • Refunds

EcommerceDasheroo's INfusionsoft CRM dashboard: Revenue

Ecommerce Overview – Trending insight of total sales, net sales and refunds are plotted in this insight. Total sales, net sales, refunds, average revenue/sale are displayed as metrics in the insight.

Revenue vs. Refund – A pie chart comparing the net revenue and refunds for the given time period.

Subscription Revenue – Trending insight of the revenue from subscription plans in the given time period. This includes total revenue and number of subscriptions as metrics.

Subscription Revenue by Plan – Plot the revenues from specific plans in the given period of time to show any trends . The total sales/revenue from each plan is plotted in this insight. Choose up to 5 plans and compare the revenue from those plans in this insight.

Best Revenue Days – In the given time period, the days with the most revenue are listed and ranked. This includes both product purchases as well as subscription revenue

Product Leaderboard – Best performing products in the given time frame. The products are ranked based on the revenue generated.This will not include any subscription plans. Only products.

SalesDasheroo's Infusionsoft CRM dashboard: Contacts

Lead Source Leaderboard – View a leaderboard insight that lists and ranks the different lead sources in the your account based on the number of opportunities associated with each lead source.

Contacts by Lead Source – Trending insight of contacts growth filtered by the lead source chosen. You can chose up to 5 lead sources and compare the growth of contacts that are tied to those sources.

Top Sales Rep by Revenue – A leaderboard insight listing all the sales representatives and ranking them in the order of total revenue.

Opportunity Pipeline Funnel – This is an overview report of the your opportunities and shows the revenue generated by opportunities in the different stages of the pipeline.

Opportunity Revenue Forecast – Trending insight of the number of opportunities and the forecasted revenue from opportunities in a given time period.

Opportunity Sales – This is a trending insight of sales generated from opportunities. The line graph includes lines for total sales (revenue), total orders (number of orders), revenue from subscriptions.

Contacts by Tags – Trending insight of contacts growth filtered by tags chosen. You can chose up to 5 tags and compare the growth of contacts that are tied to those contacts.

Opportunity By Sales Rep – A trending insight of the opportunities by selected sales representatives. You can compare the performance of the sales reps.

Opportunity Pipeline Timeline – The average number of days an opportunity stays in a particular stage. The insight is displayed as a bar graph showing each stage and the average number of days opportunities stay in that stage. The stage with the lowest average number of days is displayed as “fast moving pipeline stage” in the graph

Contacts Growth – This is a trending insight of the number of contacts in the user’s Infusionsoft account.


These awesome Infusionsoft CRM Analytics are available with the Dasheroo Grande ($19/month or Venti $49/month packages.

How To Track GitHub KPIs On a Dasheroo Dashboard

Dasheroo dashboard: GitHub KPIs
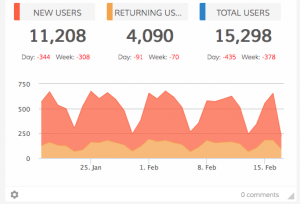
John sends an email to every Dasheroo user asking them how they heard about us and why they chose us. We get a whopping 20% of the people who get the email, replying. That’s huge. A week ago we got a reply from this awesome person Mikael from the Tunapanda Institute about getting data fro GitHub (an amazing open source project management system for software developers and product managers.)

He used to use a formidable competitor of ours until John emailed him back about our custom insights tool to get data from GitHub into an easy-to-read dashboard.

He wanted to track KPIs including a burndown chart, velocity, unassigned open issues.

Then he published the “how-to guide” on GitHub for anyone to use.

Pretty cool, we’re going to probably use it ourselves since we’re big GH fans. Thanks Mikael!


Startup Lessons Learned: Establishing Conversion KPIs

Dasheroo's internal sign up dashboard

Just one of the many KPIs we track at Dasheroo.

A couple weeks ago, I wrote about users vs. customer experience, where I shared my thoughts about the importance of each, and discussed one of the ways we measure customer experience. It’s via a KPI we have called ‘app engagement’.

Well, that’s just one critical juncture in the customer journey, and we measure several KPIs to make sure we’re on the right track.

So the team has been working hard to nail these down, and I thought I’d share them with you. Maybe they can help you establish or rethink yours, or maybe you have an idea or two that you can take away!

Here we go, the following are the Key Performance Indicators for Dasheroo:

  • Signup (SU) = a website signup for a Dasheroo account
  • SU % = # SU/Users to our website and blog (note: we remove any Dasheroo account holders from our Google Analytics ‘User’ value)
  • Connected users = SUs that connected 1+ Insights within 24 hours
  • Connected % = Connected users/SU in that week
  • Engaged users = Connected users that were active in their account in past 7-14-21-30-60 days (note: we measure engagement at multiple timeframes and also have cohort reports to pinpoint any big drop off points and to correlate activity with product releases)
  • Engaged % = # Engaged users/# Connected users in past 60 days
  • Disengaged users = Connected users not active in their account in 60 days
  • Disengaged (or Free Churn) rate = # disengaged within 60 days / #of total connected at beginning of the that 60 day period (this could also be referred to as our ‘Freemium Churn’ rate; how many people did not see the value of our offering)
  • FTC = # first time customers
  • Average Revenue Per User (ARPU)= Monthly revenue/Total paid customers
  • Monthly Recurring Revenue (MRR) = All paying customers * ARPU
  • Churn = # Paid cancels in month
  • Churn rate = Paid churn/total paying customers at the beginning of that month (note: you want to make sure not to include any new FTCs in that month)

Whew! Sure that’s a lot to measure but we feel, at least for now, that these accurately capture and gauge our performance in driving our users through the ‘conversion funnel’ from initial account signup to the holy grail: a paying customer.

And of course now we are developing custom insights for all of these to be shown and continually updated in our business dashboards.

How do you measure your business performance – have you established KPIs that help you identify where your strengths and weaknesses? Let me know!

Startup Lessons – Mobile Strategy: Acquisition or Engagement?

Scott Adams DilbertMy co-founder and VP of Product Josh and I were meeting with a senior person at Google last week, discussing ways to can work together to add value to Google users (i.e. just about everyone in the world!)

The 3-hour meeting covered a lot of topics and potential opportunities. It’s really more of a matter of WHERE do you focus – Chrome Store, Google Play, Add-on Gallery, Apps Marketplace, Android for Work, you get it.

So when we were on the topic of Android for Work, Google’s new initiative to build a huge marketplace for mobile apps for the enterprise, one question he asked was obvious: “At Dasheroo, what’s your take on your goals for mobile? If you had to choose one, is it a growth or engagement play?”

Josh and I simultaneously replied: “Engagement. Folks start on the desktop, build their dashboard and then check on their KPIs when they’re on the go.”

And that is currently true. But it also uncovered an opportunity in our approach to developing a sound mobile strategy. Mr. Google shared some stats with us on the growth of mobile search that is resulting in an action, an install, you name it, right from a mobile device. And it’s impressive growth (sorry, held to secrecy on the exact number).

Android for Work isn’t going to be our #1 focus, it’s a very enterprise-focused offering right now and we’re not ready yet. But on the drive back to San Francisco, Josh and I got to talking more about how to engage non-users when they access us via mobile.

Currently, we serve up a responsive view of our website. Sure, you can sign up for an account by filling in a couple fields, but the mobile and mobile app experience is read-only. That’s a start and satisfies most current users, but with the number of mobile searches approaching (% here) we’re soon going to be leaving money on the table!

By the time we got from San Mateo to ‘Frisco, we had a new plan roughed out: any new user (i.e. not current Dasheroo users) who hits our website from a mobile device should get a unique experience that makes it easy to add one KPI: “Add your #1 KPI now!” At least in the near term, it’d be a mountain to climb to expect a new user to build an entire dashboard with 10-12 Insights, so why not tap into the sense of immediate gratification and simplify more by offering social signup.

If our user uses their Google account, pop the Google Analytics Total Sessions Insight; a nice, single metric report that is the most popular Insight we offer. Or if they select to signup with Facebook, immediately return the one of the most popular Facebook analytics insights, Facebook Engagement? It’s informative and easy to view on a smaller screen. And if they want to add more right then? Go to town! But at least this quick win helps both sides of the coin – growth of accounts via mobile and immediate engagement.

Hey, at Dasheroo we have a lot of priorities in the hopper right now, so we need to execute on those before jumping onto this one, but it is a priority.

What’s your approach to using mobile as mainly a growth (acquisition) or engagement play? Let me know!

Startup Lessons: What’s a Good KPI, Users or User Experience?

Dilbert CartoonWe were recently at the awesome LAUNCH Scale event here in SF, and there were dozens of really excellent sessions and speakers. There was a fair amount of talk around the topic of ‘user growth or user experience?’ as a focus point for many SaaS businesses.

The main takeaway IMO is to focus on the user experience. Build a great app and overall experience, and people will sign up.

I mean, what’s the use of driving a bunch of new users if they get a crappy experience? They’ll most likely churn out, and even worse may tell others that they think you suck. But when you create a great user experience, those folks stick around, buy from you, and tell others that they should too. Makes sense!

But what is ‘user experience’, meaning how do you define it? Because if you can’t define it, you can’t measure it. And if you can’t measure it, you can’t impact the performance of it!

Here at Dasheroo, we’re obsessed with creating a fantastic user experience. For our young company, we already have a VP of Customer Success and a Manager of Customer Success. And we’re obsessed with key performance indicators. We actually have several KPIs that we’ve established for our business freemium dashboards company that help gauge user experience.

The one I’m going to discuss here is appropriately called our ‘Engagement Rate’.

Bottom line is what that means is how active folks are within our app. If they’re finding value and being active within the app, that’s a big goal for us. Plus, it’s a leading indicator of purchase and viral growth.

We use this KPI as a leading indicator of a user experience. And here’s how we calculate it:

Our calculation for Engagement Rate

  • In our case, ‘Active user’ means someone who has accessed their dashboard in a specified time period
  • ‘Users that connected to an app’ means they actually creating a dashboard in the same specified time period as our Active user count in the numerator.
  • Why’d I show an ‘X’ for the time period? That’s because we look at Engagement Rate on 7-14-21-30 and 60 day intervals.

And we set goals for each time interval, and have cohorts that show our progress.

This type of approach may or may not be relevant to your business. If it is, great. Regardless, the main point is to define it and measure it. Do we look at this KPI in isolation? Never! We also send quarterly Net Promoter Score (NPS) surveys, usage surveys and have several other KPIs ‘upstream’ and ‘downstream’ in the customer journey.

We always want to improve our user experience and engagement, and are currently working on features and functionality that will hopefully drive that rate higher.

How do you measure user experience? Let me know!

Oh yeah, don’t get me wrong. We LOVE users, but with a great experience, those users will be quality ones.

Plus, watch for an upcoming post where I’ll discuss more of our customer journey KPIs.