 We were recently at the awesome LAUNCH Scale event here in SF, and there were dozens of really excellent sessions and speakers. There was a fair amount of talk around the topic of ‘user growth or user experience?’ as a focus point for many SaaS businesses.
The main takeaway IMO is to focus on the user experience. Build a great app and overall experience, and people will sign up.
I mean, what’s the use of driving a bunch of new users if they get a crappy experience? They’ll most likely churn out, and even worse may tell others that they think you suck. But when you create a great user experience, those folks stick around, buy from you, and tell others that they should too. Makes sense!
But what is ‘user experience’, meaning how do you define it? Because if you can’t define it, you can’t measure it. And if you can’t measure it, you can’t impact the performance of it!
Here at Dasheroo, we’re obsessed with creating a fantastic user experience. For our young company, we already have a VP of Customer Success and a Manager of Customer Success. And we’re obsessed with key performance indicators. We actually have several KPIs that we’ve established for our business freemium dashboards company that help gauge user experience.
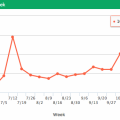
The one I’m going to discuss here is appropriately called our ‘Engagement Rate’.
Bottom line is what that means is how active folks are within our app. If they’re finding value and being active within the app, that’s a big goal for us. Plus, it’s a leading indicator of purchase and viral growth.
We use this KPI as a leading indicator of a user experience. And here’s how we calculate it:
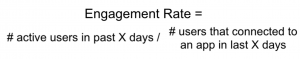
- In our case, ‘Active user’ means someone who has accessed their dashboard in a specified time period
- ‘Users that connected to an app’ means they actually creating a dashboard in the same specified time period as our Active user count in the numerator.
- Why’d I show an ‘X’ for the time period? That’s because we look at Engagement Rate on 7-14-21-30 and 60 day intervals.
And we set goals for each time interval, and have cohorts that show our progress.
This type of approach may or may not be relevant to your business. If it is, great. Regardless, the main point is to define it and measure it. Do we look at this KPI in isolation? Never! We also send quarterly Net Promoter Score (NPS) surveys, usage surveys and have several other KPIs ‘upstream’ and ‘downstream’ in the customer journey.
We always want to improve our user experience and engagement, and are currently working on features and functionality that will hopefully drive that rate higher.
How do you measure user experience? Let me know!
Oh yeah, don’t get me wrong. We LOVE users, but with a great experience, those users will be quality ones.
Plus, watch for an upcoming post where I’ll discuss more of our customer journey KPIs.