Track Our Startup: Talking to Customers Gives Us Clarity

Dasheroo talks to customers about dashboards

Josh’s feedback from talking to customers.

Lately we’ve been questioning the dashboard roadmap we laid out a half year ago to see if it matches where we’re at as a company now,which is a very different place! So Josh took to the phone (huh?) to actually talk to a variety of our customers to see who they are and what they’re trying to accomplish with their business and Dasheroo.

He specifically asked them about their current experience, what they liked and what they thought we needed to fix. And then asked them what they’d like to see in the future with Dasheroo. Of course these users were engaged enough with our product to actually spend time talking to us so next steps would probably be to try to get the users that are not engaged with Dasheroo to find out why and what they’d like to see. But it’s been a great eye-opening experience! Thanks Josh!

Dasheroo Dashboards - Google Analytics traffic

We’re so close, check out our Dasheroo dashboard for Google Sessions. Isn’t it pretty?

We’re a step closer to enabling users to push a dashboard into Google Drive. This is a real time-saver for people who copy and paste a bunch of data!

We got a nice mention inn Marketers Paradise, 7 Marketing Tools You Should Try This Week. Thanks guys!

Our Trek to 1000 Google Sessions/Day!
Our organic channel (search) traffic has been on fire since we really started paying mind to it last year. As a result it’s doubled in just a few months! Direct channel traffic has been growing like crazy too. Since we don’t spend an ad dollars (just a few on Facebook) these two channels growing is exactly what we need to see, great word of mouth! We’re almost there, last Monday we hit 937 sessions (visits) and based on our 10% conversion rate we’ll almost hit 100 new users in a day. Woohooo! Great job, great product, great sales, great marketing.

Your Own Custom Data on a Dasheroo Data Dashboard

All companies have a ton of data and it’s all over the place. I mean we created Dasheroo because of that very problem. Access to data in Facebook is different from Twitter is different from Google Analytics and the list goes on. One of the benefits of Dasheroo is the art of visualizing that data in the same format so you can really compare apples to apples and know what you’re looking at.

Dasheroo custom data dashboard

Good to know we had just one bad day, then it’s all smooth!

But we’ve seen a very large chunk of people lately using us to get access to internal data that they’ve never been able to see. Huh? I mean we thought that folks would have their data in a spreadsheet and for that we pull data from Google Sheets. But internal data was an interesting one. We built it from the start (thanks James!) but the usage of the product has been a) going through the roof and b) being asked for by huge companies you’d be surprised by.

Think about it, you’re probably in a company where your CFO or head of finance/accounting has access to some great data that might help you market, sell and make better decision with. Conversely if you are the head of finance you might want an easy way a) to get data to the masses (so they’ll quit buggin’ ya) and b) to see what marketing is spending money on and sales are closing.

With access to a custom data dashboard you can view things like:

  • When specific sales or legal contracts are expiring –
  • How many people buy product a and b together, how many don’t
  • How many errors you’re getting on your website
  • How many people are signing up or logging into your online product
  • How many users are churning out (canceling their account)

So here’s what you’ll need: 1 web developer + a web server + 15 minutes of time. Then POOF, you’ll have your data on your dashboard continuously updated! Watch this short video and show them this extremely short documentation!

Startup Lessons Learned: Meetings – Go for The Face-to-Face

Cartoon: Face to faceMeetings. Meetings, meetings and more meetings. It’s easy sometimes to start to think of meetings as time sucks rather thanan investment in your business. Well, actually some meeting ARE time sucks, so just whack those out now, OK? But especially if you’re in business development, partnership or sales mode it’s so valuable to get in the car, train, bus, subway, Über or whatever and try your best to take these meetings in person. At their place of business.

It’s amazing how you can cut through the crap and make 10x the progress via just a phone call. It shows you value the relationship, and it’s amazing how often your prospect or potential partner will include additional decision makers when they know you’re showing up in person. People also tend to be more transparent in face-to-face meetings as well, and it’s typically easier to get a ‘read’ on the situation, opportunity, and how well the respond your solution.

I don’t know about you, but via phone, I get a lot of “yeah, that sounds interesting, let me double back with my team and I’ll get back to you in a couple weeks…” Yeah, right.

But in person, the discussions are typically are more driven from an honest reaction to how your solution fits or doesn’t fit into their business, and what their internal or external challenges are. And that leads to immediate discussion around those issues, with more people involved. And at that point what I’ve learned in they really want to work towards a solution.

I recently almost slipped into a ‘phoner-mode’ with a potential partner; I had a couple conflicts, it was the day before I was leaving for a trip, excuses, excuses. I thought more about it, called the guy back, and said “You know, I think it’d be way better to meet at your office instead of a phone call.” He really appreciated it, and included 2 additional decision makers that would not have been on a phone meeting. And instead of a 30-minute call it turned into a hugely productive 1 hour and 15-minute meeting with concrete takeaways and a solid action plan. And some great chemistry; we both really want to find a way to work together.

Is it a done deal yet? Not yet. But I guarantee it’s way further down the road toward a ‘yes’ and potentially much bigger, than we all originally thought!

Now, my startup lesson this past week? Time is valuable so Im not recommending in-person meetings for each one; just the ones you think are at the level of importance to get in there, show off your stuff and push the deal ahead faster.

Front of House: Digital Dashboards the Food & Beverage Scene

Front of House logo for Dasheroo Dashboards Case StudyWe had the opportunity to catch up with Dasheroo users Adam and Dillon, founders of Front of House. Front of House is a NYC-based digital marketing and content creation agency that caters heavily to the food & beverage scene, singing a new age, content driven & analytic supported song in an industry whose marketing sounds have been notoriously flat.

We love to hear exactly how Dasheroo users are using their dashboards. Here are the answers to the tough questions we love to ask.

Can you describe your team of 10?

Dillon: Adam and I are split partners and both oversee operations. We have two account executives who oversee the operations of 10 or so accounts each, a full time photographer, one full time graphic and web designer, two account managers who monitor, post and community manage our accounts and two outreach associates who strategically grow our clients social community.

What did you use before you found Dasheroo? How long did it take you to gather your metrics?

Dillon: Prior to using Dasheroo we manually developed month end reports using a mixture of Iconosquare, Sprout Social and Facebook/Twitter reports. It was a monthly pain in the ass and probably took us 8 hours a month but it got the job done and provided us the flexibility we needed. We found manually generating short 4 or 5 page PDF’s provided relevant info to satisfy clients. Analytic relevance is huge for us because the food space is so unique in its offering. Unlike many of today’s major digital industries, the F&B/hospitality’s product is truly tangible. Its easy to track the sale of an iPhone case through Instagram, its not the same story with a cheeseburger. So although the industry’s ROI will presumably never be fully trackable we needed our dashboards to showcase some metrics other industries may not feature so predominantly.

What were the most important features you need in a dashboard for FOH?

Dillon: We look heavily to Instagram as our primary platform so it is heavily prioritized but in terms of reporting we look to similar metrics across the board. Engagement, Follower Growth and Recent Activity. Many of our clients provide us with complete creative control, its the reason we are hired. So providing a concise month or week end recap is crucial for them. Rather than spending 20 minutes a day checking in on us, they spend an hour at the end of each month. We would love a bit.ly integration and a few other tweaks to Dasheroo would be hugely beneficial to us but it really pulls almost all of the data we could want.

Did you gain any new insight using Dasheroo?

Dillon: We haven’t gained any new insights but it seems to be saving us quite a bit of time.

Does more than one team member use Dasheroo? What other functions in the company?

Dillon: Since we started using Dasheroo we’ve on-boarded all of our employees to the organization. Its a tool I’d like every team member to be proficient in. We’ve also shared our Dashboards with clients who are interested in a more real time snapshot of their accounts – which is an incredible tool.

And there it is, Dasheroo gives you more time to run your business. Thanks again to Dillon and Adam!

Track Our Startup: Website Tests + Google Dashboard Features +

We released Notes this week and in case you missed it last week we released Hubspot! You test out this premium app free for a month with a code, check it out. It’s pretty cool to see your Hubspot KPIs alongside your social media and web analytics metrics.

Testing 1-2-3

Alf tested a long form vs. a short form sign up. Until now we’ve only asked for Company Name and an email address. Now we’re asking for more information and our users are giving it to us. It’s always better to know more about the type of customer we’re getting.

Dasheroo sign up form test dashboards

He’s also about to test some new headlines. More on that as we know more.

Dasheroo home page test - dashboards


Dasheroo Got Some Mentions!

We got on another great list in this podcast 7 Marketing Tools You Should Try This Week thanks Marketer’s Paradise! Jack Dean also posted Build your first Business Dashboard. And Janine wrote a great one for Inc.com, 5 Ways A Commute Can Kill Productivity. It really can can’t it?

Sales

Mimi our amazing salesperson closed one of our biggest deals ever this week. We’ll probably not mention who they are but boy are we excited and I thought it well-deserved a mention. Not to mention she’s closed the most deals ever in a month since we started!

Features; What’s Next?

On the product horizon we’ve switched gears a bit to focus on Google Apps integration where we’ll be pulling Dasheroo dashboards and insights into Google Drive. Right now we can give you dashboards FROM data in a Google Sheet, but this would be the other way around. Nifty huh? So not only will you be able to pull data from your Dasheroo Google Dashboard but any social media dashboard, sales dashboard or marketing dashboard you have!

For features in the more near term we’re working on scrolling insights so you can see the last 10, 25 or 50 items by scrolling.
  • Mailchimp: Recently Sent Emails
  • Twitter: Highest Engagement Tweets, Recent Tweets
  • Facebook: Recent Posts, Highest Engagement Posts
  • Instagram: Recent Posts, Highest Engagement Post

We’ve also been working on these additional insight types for Push API and after that Zapier, right now it’s a line graph only.

  • Bar Chart Insight
  • Leaderboard Insight
  • Pie Chart Insight
  • Funnel Chart Insight
  • Table Insight

The last thing we’re working on is the ability to schedule a recurring delivery of an exported dashboard!

We gotta get back to work!

New Release: Add Notes on Your Dasheroo Dashboards!

We’ve been asked by so many of our users to add simple notes to their dashboards and why not? Notes personalize your dashboard even more.

Dasheroo dashboards: NotesWhy would you use a note?

  • You want to describe in detail what the dashboard is to anyone you collaborate with.
  • They remind you what you’re looking at!
  • You want to make a note to yourself when you’re analyzing your KPIs and perhaps insert a link that has more information.
  • You want to leave a note for someone about a specific metric that went off the roof with a link to where the numbers are coming from.
  • You want to give a comprehensive description of how to use this dashboard. And because the notes SCROLL you can go crazy on the number of words you add in your note.

You can delete notes if they’re time-sensitive, you can add new ones, you can have as many as your plan allows!

There are so many ways in which notes can be incorporated into your dashboards for KPI tracking and explanations. Go ahead and add one!

Startup Lessons Learned: It’s All About People

Every day I talk to our startup team at Dasheroo, anyone on it, I’m reminded how lucky I am to have the best team I’ve ever had the opportunity to work with.

People make technology happen, not the other way around.

Our team goes above and beyond to listen to customer’s needs and develop software that fits the future. They anticipate what will be asked for and ensure that we can grow into how we build things. That’s a pretty amazing crystal ball to look into.Startup Dasheroo basecamp project

People need to really care about what they do.

Our team is THE most caring team I’ve ever worked with. They are often up all hours, working with customers world-wide, and they contribute amazing ideas to our future. We even have a think tank project for our small team in Basecamp called Crazy Ideas. Our team is posting to that all the time and it’s not only engineers, it’s sales and marketing too!

People need to care about who they build it for.

Our team loves our customers. I send an email entitled “quick question” to all new users, just asking them where they heard about us and why they signed up. When anyone replies (and 20% of you do!) the replies go to everyone in the company. And I assure you they are read by everyone. When a support question comes in, everyone gets the email. Why? Because everyone wants to know what our users need. This startup team wants to dig in and understand how they can make our user experience the best it can be.

I write this (and the team knows it) because it’s true. Team, you are the best I’ve ever worked with, thanks from me and on behalf of all of our users for being great people!

Twitter Analytics: The Importance of Knowing Your Audience

With 320 million monthly active users, you know that Twitter provides a unique opportunity to connect with customers, prospects, and thought leaders among others. And while a large number of followers is a step in the right direction, you won’t fully understand what to do next until you start tracking your Twitter analytics.

Here are three questions to address:

1. Are You Tracking When Your Followers are Online?

There are instances when timely tweets are necessary, such as to announce breaking news. There are also times when you should wait to make an update.

By tracking when your followers are online, you can increase your reach while improving the chance of engagement (retweets, replies, mentions, and likes).

Tweriod Twitter Analytics dashboard

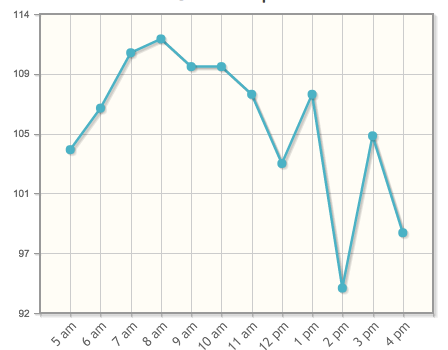
At Dasheroo we schedule our Tweets between 6am and 11am!

Tweriod gives you a nice taste of when a portion of your followers are online for free. If you upgrade to premium most people will pay between $4-$8/month with a robust offering.

2. When is the Best Time to Post?

This goes along with question #1 above. Once you know when your followers are online, it’s easier to understand the best times to post.

Like many, you don’t have enough time in your schedule to tweet throughout the day. For this reason, you need to schedule out posts at relevant time intervals.

Buffer and Hootsuite really help with automation of posts. Here’s a great article on using Buffer and another one on using Hootsuite to automate your Tweets!

amplification_rate-37c16ba1dd3ec0e9957571ab4f6305f2
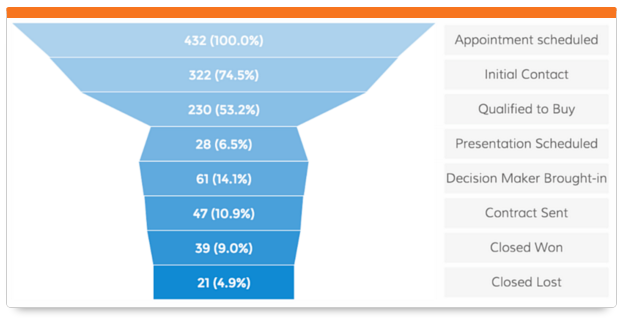
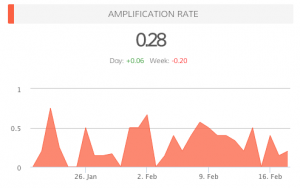
3. What is Your Amplification Rate?

When you know when your followers are online, when you know the best time to post, your amplification rate will increase. This is the rate at which your followers share your tweets (amplification = number of RT’s per tweet).

Your goal with each tweet is to generate as much engagement as possible. Retweets are important, as this means your followers are sharing your updates with their followers, thus increasing your reach.

Do You Need Help Answering These Questions?

In addition to Dasheroo, experiment with other services, like Tweriod, that provide data on the best times to Tweet. By analyzing your Tweets, as well as your followers’ Tweets, you will have a better idea of when it makes sense to publish updates.

In the near future, we plan on providing additional Twitter analytics, such as when followers are online and the ideal times for posting.

Can you think of any other features that could benefit your social media strategy?

P.S. Did you know we have free Twitter Analytics dashboards for you to track? Check them out today!
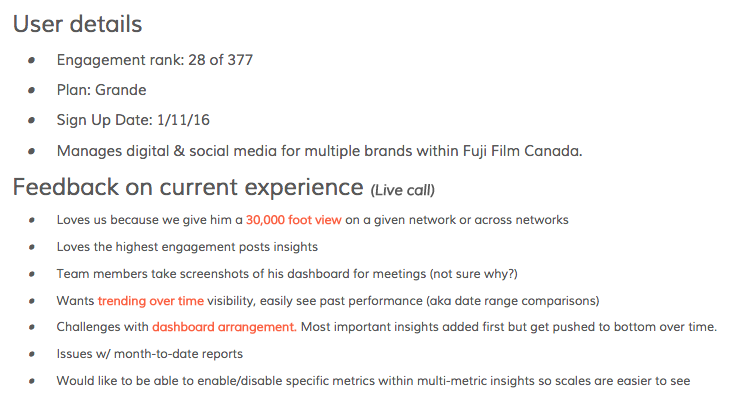
Track Our Startup: HubSpot + New Platform Features on the Horizon

The team here has been busy with our new HubSpot dashboards release. We now have 13 new insights crossing CRM, sales and marketing for any HubSpot user. You can get a free month to try it out. Then it’s available for anyone who has our Grande or Venti plans.

Dasheroo dashboards: Notes

This is a “notes” feature you’ll be able to add to your dashboards!

Janine and I attended Infusionsoft’s ICON event in Phoenix. What a great team of people there and an awesome show for any business to get the need-to-know for all things marketing, sales, CRM and e-commerce related. Way to go guys! If you didn’t know we have Infusionsoft insights for Dasheroo. Check them out here, you can also have a free month trial just like HubSpot.

We’ve been working on our next P release, P is for Platform so that means features we’re working on happen across the entire product. Dasheroo users have been asking to include notes within a given dashboard. When we release this you’ll be able to add text that could be bold or italics and you can add a link! Pretty cool.

Another part of our P release is testing the ability to scroll within an insight. So say for instance you have 25 email marketing campaigns you wanted to see the results of. Right now we give you the ability to see the last 10. But if you segment your lists and happen to send more than 10 in a given week, you have to go to the native app. We’re testing the ability to let you scroll through 10, 25 and 50. You can imagine how we can then take that into your Tweets, Facebook posts, Instagram Analytics and anything you do a bunch of times. Great job to James and his awesome team.

We continue to march down the investing path. It’s not a great time to be raising money. We’re also talking to strategic partners. We read this great interview with Heidi Roizen that really talks about choosing the right VC, we really like her:-)

New Release! New Dasheroo Dashboards for HubSpot

hubspotHubSpot has features for social media marketing, email marketing, web analytics, search engine optimization and a new CRM solution which includes deals, companies, sales pipeline process and more.

With the expert help from HubSpot, we’ve created 13 dynamic insights for your dashboards, with a few more to come in the near future.

Email Marketing

List Growth – View the total number of email addresses added to selected lists by day.

CRM

Dasheroo dashboards: Hubspot analytics

View what stage of the funnel your deals are in HubSpot.

Contacts – View the total number of contacts added to your HubSpot account in the given time period and how it trends.

Contacts Lifecycle Funnel – View a funnel insight that shows the lifecycle stages and the number of contacts in each stage.

Deal Stages Pipeline – View a funnel insight of the number of deals in different stages of the sales lifecycle.

Top Contacts by Lead Score – View a leaderboard report of contacts ranked by their lead score.

Workflow Performance – View a trending line insight showing the number of contacts in each stage of the selected workflow’s performance.

Sources

Displays the different sources of traffic and number of visits from each.

Displays the different sources of traffic and number of visits from each.

Sources Distribution – View the different sources and the number of visits, contacts and customers they generate.

Customers by Source – View sources of traffic and the number of customers each generated in the given time period.

Contacts by Source – View sources of traffic and the number of contacts each generated in the given time period.

Visits by Source – View sources of traffic and the number of visits each generated in the given time period.

Keywords

Dasheroo dashboards: Hubspot analytics

Keep a close eye on how many leads specific keywords generate!

Top Keywords by Visits – View a leaderboard insights that ranks keywords based on the number of website visits they generated in the given time period.

Top Keywords by Contacts – View a leaderboard insight that ranks keywords based on the number of contacts they generated in the given time period.

Top Keywords by Leads – View a leaderboard insight that ranks keywords based on the number of leads they generated in the given time period.


These awesome HubSpot Analytics are available with the Dasheroo Grande ($19/month or Venti $49/month packages.