Track your HubSpot analytics right within your Dasheroo data dashboard! Add key email marketing, sales and CRM insights from HubSpot right alongside your social media marketing and website analytics KPIs to one great-looking dashboard.
Want to see how your subscription business is doing? How many deals do you have in the pipeline? How are your email campaigns performing? Combine that with your website traffic from Google Analytics and your social media followers and you’ve got one great set of KPIs to view to get an up-to-date snapshot of how your business is performing.
Best of all, it’s all in one place: Dasheroo.
Available HubSpot Dashboard Insights
Contacts
View the total number of contacts in your HubSpot account and how it trends in the given time period.
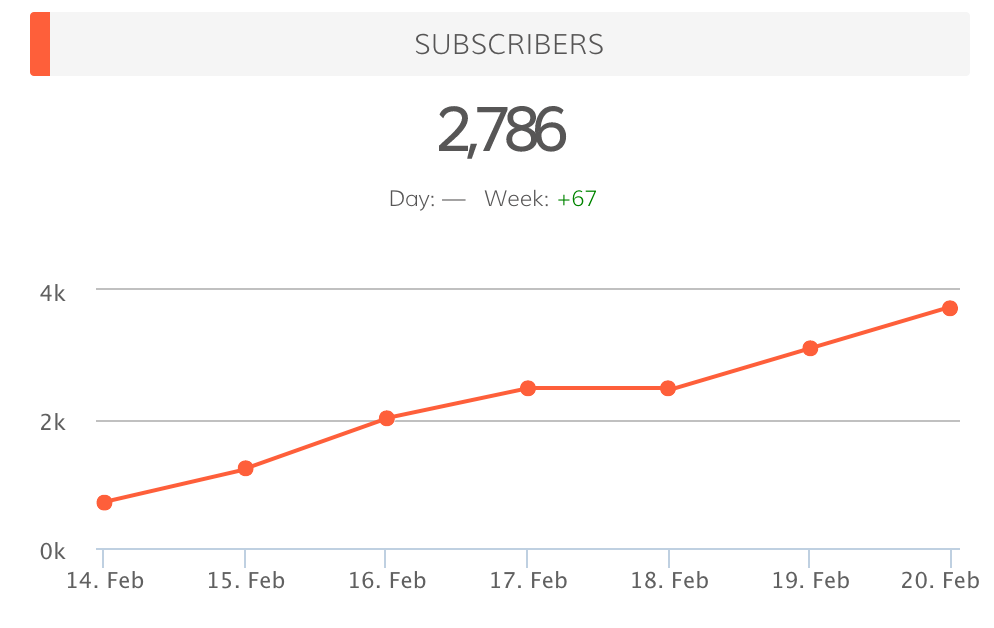
List Growth
View the total number of email addresses added to selected lists by day.
Contacts Lifecycle Funnel
View a funnel insight that shows the lifecycle stages and the number of contacts in each stage.
Deals
Display the number of deals won, lost and total deals in the form of a stacked area graph.
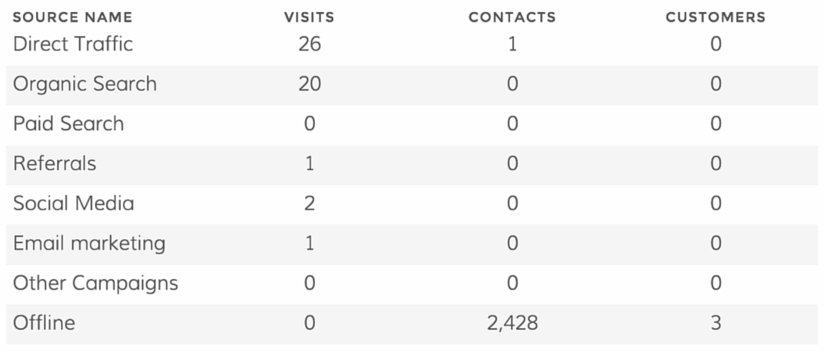
Sources Distribution
View the different sources and the number of visits, contacts and customers they generate.
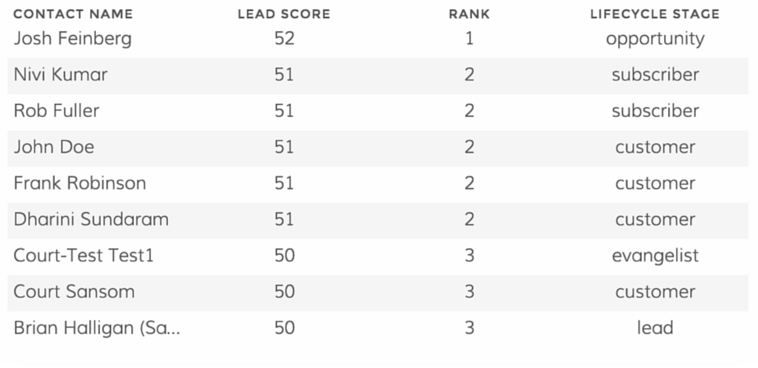
Top Contacts by Lead Score
View a leaderboard report of contacts ranked by their lead score.
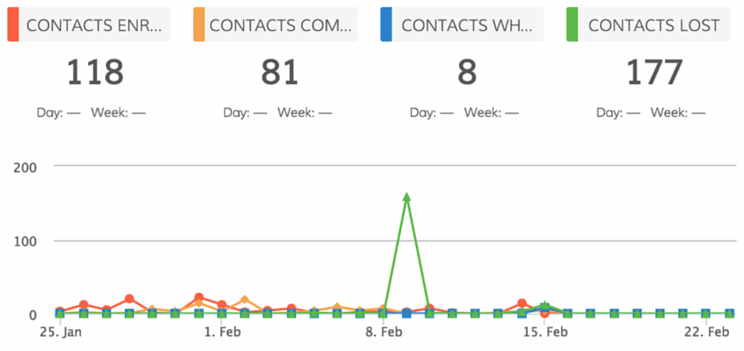
Workflow Performance
View a trending line insight showing the number of contacts in each stage of the selected workflow’s performance.
Customers by Source
View sources of traffic and the number of customers each generated in the given time period.
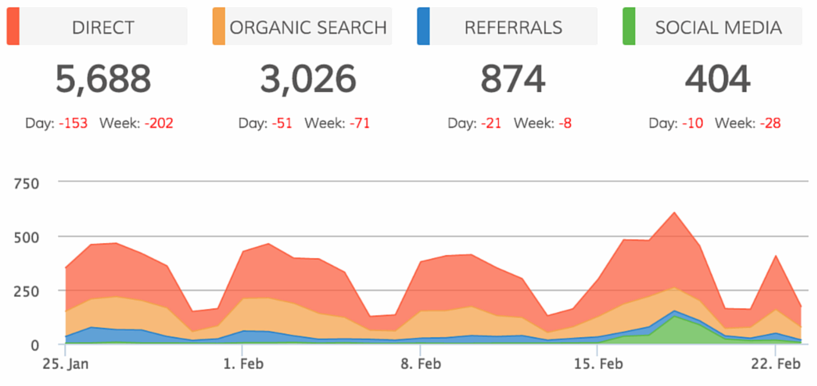
Contacts by Source
View sources of traffic and the number of contacts each generated in the given time period.
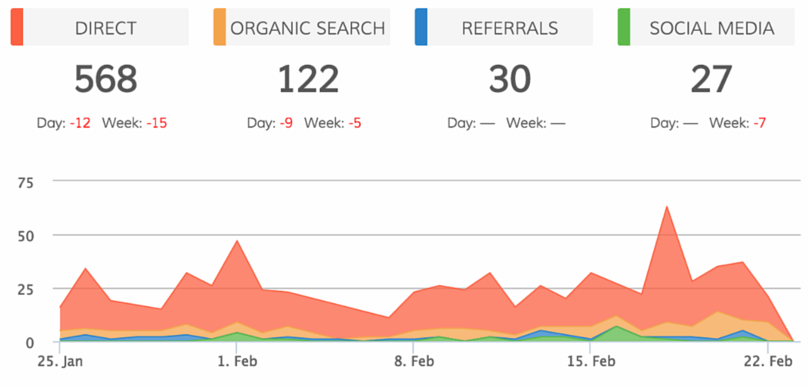
Visits by Source
View sources of traffic and the number of visits each generated in the given time period.
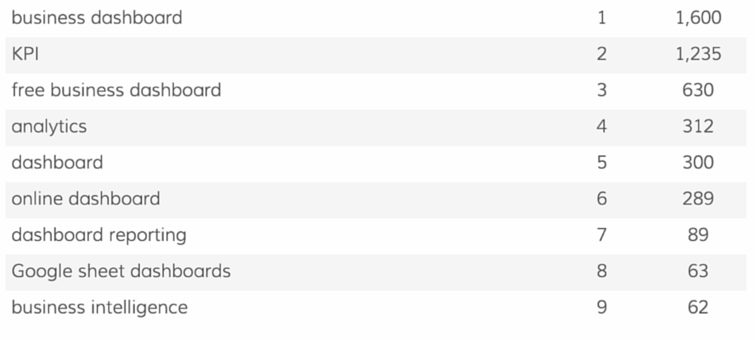
Top Keywords by Visits
View a leaderboard insights that ranks keywords based on the number of website visits they generated in the given time period.
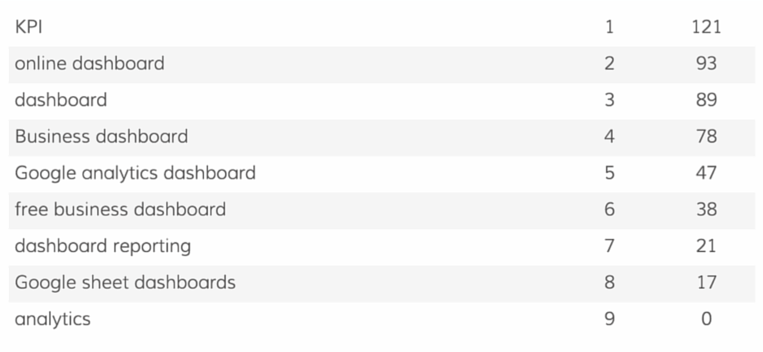
Top Keywords by Contacts
View a leaderboard insight that ranks keywords based on the number of contacts they generated in the given time period.
Top Keywords by Leads
View a leaderboard insight that ranks keywords based on the number of leads they generated in the given time period.
Get Your Free Dasheroo Account!
- No limited-time trial periods — Dasheroo is FREE!
- No training or complicated implementation
- Quick set-up with ready to go dashboard templates
- Powerful, easy-to-use, and fun!