3 Reasons to Regularly Review Facebook Analytics Data

Are you in the habit of regularly reviewing Facebook analytics data? If so, this is something that will continue to work in your favor well into the future. But if not, now is the time to make a change.

Just the same as other social networks, such as Instagram, there are reasons why you should keep a close watch on Facebook analytics data. Here are three of the best:

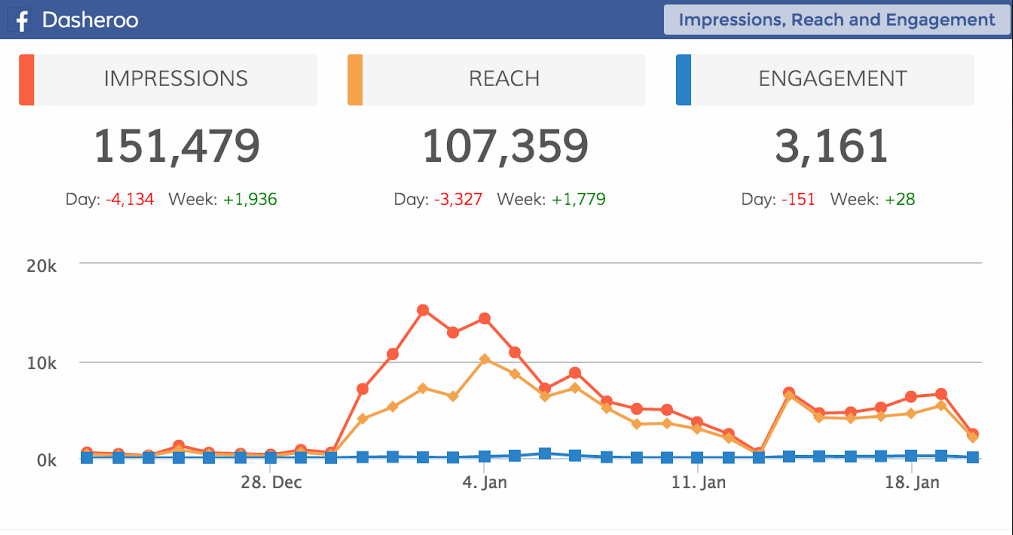
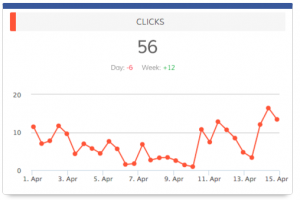
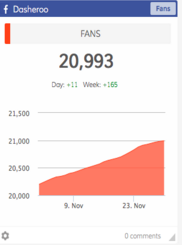
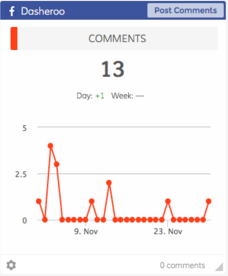
1. To Track Engagement

This includes the following:

  • Clicks
  • Shares
  • Likes
  • Comments

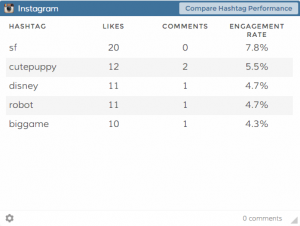
Engagement is a must, and you want to see all four of these metrics increasing with time. Taking this one step further, pay attention to the type of posts that receive the highest level of engagement. This will help you create more targeted content in the future.

Questions are always a good engagement mechanism, especially if they’re interesting! Videos are also a must for engagement on Facebook.

2. To Better Understand Your Facebook Audience

It’s one thing to track engagement and notice a positive trend. It is another thing entirely to have a firm grasp of your audience. This means focusing on details such as:

  • Gender
  • Top languages
  • Top cities
  • Top countries

For instance if you see that you’re surprisingly getting more customers from a location you thought you wouldn’t you might want to target a Facebook ad campaign to people in that location to get more customers.

How much do you know about your Facebook audience? How are you using this data to your advantage?

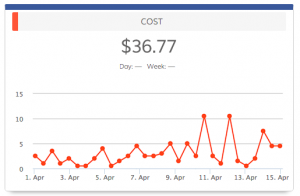
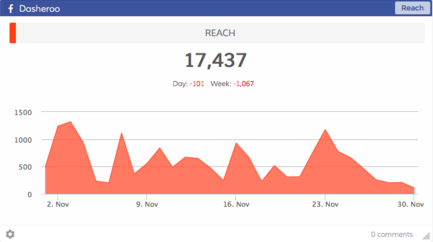
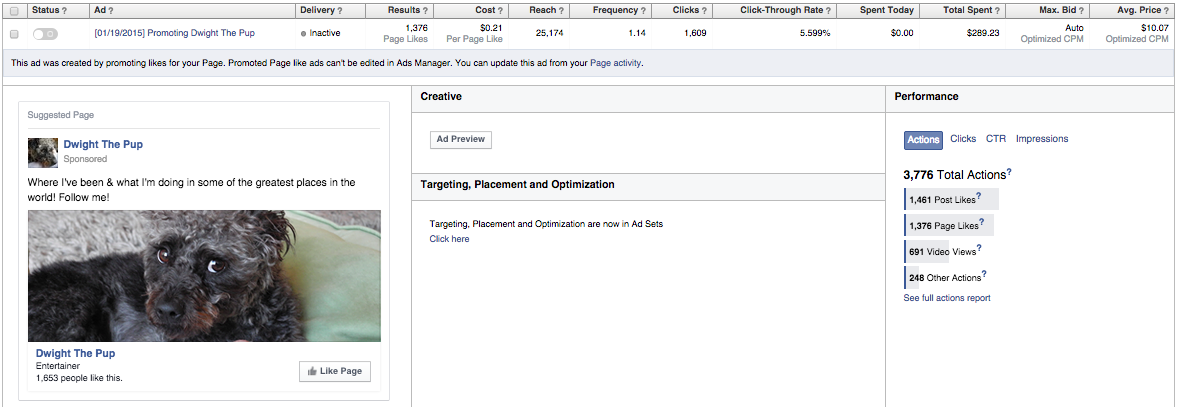
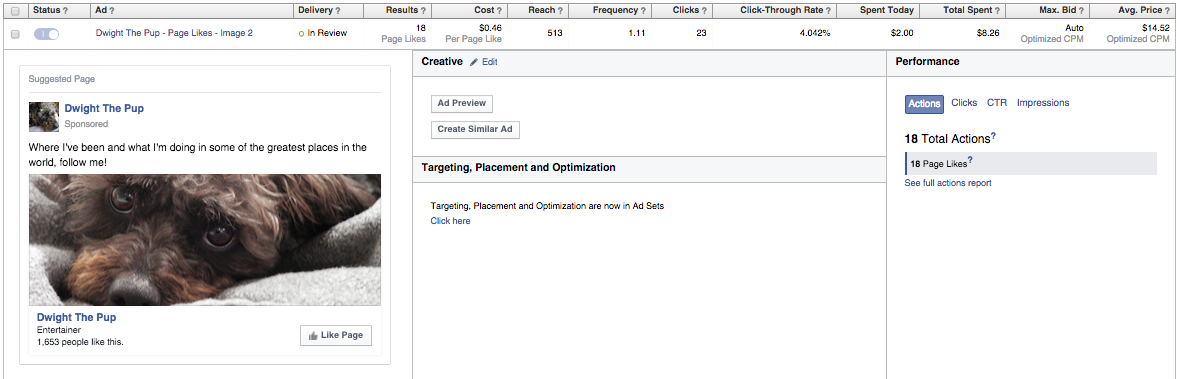
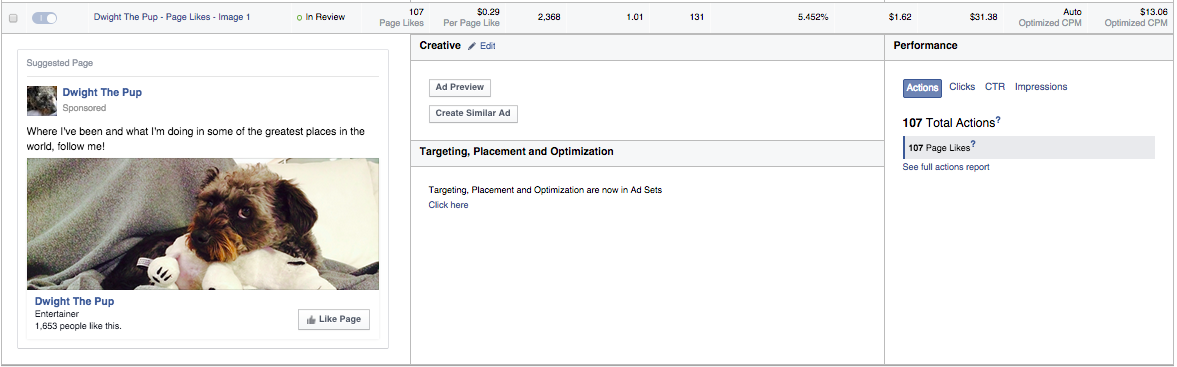
3. To Improve Facebook Ads Performance

Through the use of Facebook analytics, you can gain insight into the type of content that performs best. As a result of your findings, it becomes easier to create Facebook ads that increase reach and engagement.

If you plan on spending money on Facebook ads, you might as well get the most bang for your buck. This starts with reviewing analytics data.

You’ll want to see what type of ads get you the most clicks and impressions. For instance you can test different images on the same ad. Facebook will then serve up the ad with the image that gets the most engagement. Then you can turn the other ads off and test against it. Pretty cool huh?

Final Word

There are more than one billion people active on Facebook, but the majority don’t pay any attention to analytics data.

As you spend more time tracking, reviewing, and comparing this information, your opportunity for success goes through the roof. Could this be just what your business needs?

New Facebook, Google, Stripe & Instagram Analytics Dashboards

We’ve been on a new release tear. Our Product Managers Nivi and Dharini working closely with our integrations team are on fire pushing out new integrations and insights for you to add to your dashboards and this one is far from a slouch! This time we went back to a few integrations to add more insights to our growing list of metrics we track: Instagram & Facebook Analytics, Google Analytics and Stripe.

Also many thanks to Court, our QA Manager who works tirelessly around the clock testing our code, especially when we have this many releases we’re juggling.

Facebook AnalyticsDasheroo dashboard: Facebook analytics for Reach Impressions

  • Reach broken down by Organic and Paid reach over time – This is great to see if your paid performance does better than your organic, then you can choose how to spend your marketing dollars.
  • ​Impressions, Reach and Engagement on one insight together – Instead of viewing each by itself it’s great to see them together.
  • Post Consumptions by Type – This insight can provide a measure of engagement beyond traditional engagement metrics such as likes, comments and shares. There are 4 types of consumptions – link clicks, photo views, video plays and other clicks. Other clicks correspond to likes, comments or shares that generate stories.
  • Negative Feedback – The number of times people took a negative action by 4 types – hide clicks, hide all clicks, unlike page, report spam. You can view when you’ve been posting and how often and match if people are ‘dis’ liking your content and act accordingly.


Hashtag Performance

Track your #hashtag performance right in your Dasheroo dashboard.

Instagram Analytics

  • Hashtag Leaderboard – A leaderboard insight consisting of the top 12 hashtags you use based on the engagement to let you know how to use them in the future.
  • Compare Hashtag Performance – Choose and compare up to 5 hashtags (in the last 30 days) based on engagement metrics.
  • Highest Engagement Filters – A bar chart showing the top 5 Instagram filters you use in decreasing order of engagement.

Google Analytics

  • Enhance ‘Top sources by medium’ insight to include email and social sources – we just should had those included, our bad.

Stripe

  • Revenue by product name/product description so you can tell immediately what’s flying off the shelf.

Infusionsoft

  • Failed Transactions – A table that shows the list of failed transactions along with the reason for failure within the given time period.

So what are you waiting for? Get in there and add them to your dashboards!

Track Our Startup: New Dashboards + New Data Sources Coming!

As you know we’ve had a ton going on this quarter already and it’s only the first week of February! We announced our Push API that went live last week. Check out our posts, they’re awesome and great for our growth and scale.

What’s Up Next?

  • Alerts – We’re so close getting this important feature over the finish line! You’ll get an alert when a threshold you set is reached!
  • Hubspot – This is a big one for us, we love the folks over at Hubspot. You’ll be able to get all of your important KPIs from Hubspot right in your Dasheroo dashboards.
  • Sendgrid – If you use Sendgrid for your transactional emails, we’ll provide you how they’re performing and how they’re being delivered.
  • Facebook Ads & Google Adwords – We’re revisiting our pay-for-performance partners to enhance those dashboards. More to come as we research.
  • Mixpanel – We’re in research mode here but we love this integration. We are avid users of Mixpanel so we want to make sure we nail it for everyone who uses this awesome product to track users around your site.

Isn’t that enough? No, we know it’s not. The list never ends. If you want to see insights from data sources you use regularly make sure you get them on the list.

Oh and I’m off the grid till next week (in Burma!) but on the grid enough that you’ll hear from me. Speaking of, how is it that “Burmese” people live in “Myanmar”? Should they not live in Burma? I sure think so;-)

Track Our Startup: New Insights + Dasheroo Dashboards On the Appexchange

Dasheroo Dashboards on Salesforce AppexchangeThe Dasheroo steam roller keeps rolling! As you know we announced yesterday that we have an app on the Salesforce Appexchange and we’re pretty stoked about it. It gives any Salesforce user the opportunity to stick Dasheroo dashboards in a tab in their account. Pretty cool huh? Get It Now from the Appexchange and if you like us please give us a review!

New Insights for Your Dashboards

We always want to revisit applications we integrate with to see if we need to keep adding to them, especially if our users give us the feedback that they want them. So we did and in a week or so we’ll be adding Facebook, Instagram and Google Analytics along with a Stripe insight to the mix, you’ll be really happy about them.

We got the team together to go over our focus for the next year, get as many users to the site as possible (inexpensively), pay close attention to “who” is using us, follow up with potential high-value contacts and build for the scale of the future. Great questions were asked and we’re marching forward to grow.

I was really excited that the Product Team got together and created a real Product Calendar (and it goes out pretty far!). We’ve got our roadmap nailed for the first quarter at least so it’s a great thing that we all know what we need to work on.

Ink!

Janine wrote a great article you need to read, 12 Great Content Ideas in 12 Months for Inc.com. It’s jam-packed with amazing ideas so check it out. We also got some great mentions by blogger and marketer Anna Fatlowitz, How I Doubled My Instagram Followers in Two Weeks, and Afton Negrea, How to Create a Social Media Routine that Rocks. Thank you, thank you, thank you.

Facebook Ads Analytics: 3 Metrics You Need to Track Right Now!

Are you among the 92 percent of social marketers using Facebook for advertising? If so, here is something to remember: there is more to advertising than spending a few bucks (or more) and hoping for the best.

We’ve talked about the importance of monitoring your Facebook Ads cost per page like before, but there are more Facebook analytics you can be looking at too. If you want to get as much as possible out of your Facebook Ads, it is imperative to track a variety of metrics. This will allow you to make adjustments on the fly, while also saving both time and money.

Here are three metrics you need to track:

Ad CostsDasheroo Facebook Analytics for Ads- Ad Costs

Wouldn’t it be nice if you had an unlimited amount of money to spend on Facebook advertising? Unfortunately, this is not the real world. Regardless of your business, industry, or goals, it is safe to assume you have set an advertising budget.

Tracking ad costs allows you to:

  • Stay within your budget.
  • Calculate return on investment (ROI).
  • Understand your spend over time (daily, monthly, etc.)

Note: dig deeper by filtering costs by account, campaign, single ad, or ad set.

Impressions

What good is a Facebook ad that doesn’t reach your target audience? You need to compare your spend against the number of impressions (defined as the total number of times your ad entered the screen for the first time). This metric does not guarantee your audience will take action, but it does prove that people are at least viewing your ad.

Impressions can be viewed by date, allowing you to see which days of the week generate the best results.

ClicksDasheroo Facebook Analytics for Ads - Clicks

It may be important to track impressions, but it is clicks that matter most. This metric allows you to track the total number of clicks on an ad over a period of time.

Depending on what you are promoting, this could include everything from app installs to page likes (and much more).

There are two other metrics that fit within this category:

  • Cost per click: calculated by the amount spent divided by the number of clicks.
  • Click through rate: all clicks divided by impressions.

As a general rule of thumb, you want to keep your cost per click low and your click through rate high. This will yield the “most bang for your buck.”

What Now?

Now you’ve got the knowledge (and power!) necessary to track a variety of essential Facebook advertising analytics. When you combine this with organic Facebook metrics, you have a killer strategy that will allow you to achieve success on this platform.

Facebook Analytics: 5 Must-Track Metrics

We’ve talked about important trends to spot in a Twitter analytics dashboard. We’ve also touched on Google Analytics metrics and why LinkedIn marketing is a must. Now it’s time to take a closer look at Facebook analytics, including five must-track metrics.

FansDasheroo Facebook Analytics Dashboard - Fans

Fans, fans, and more fans. There is nothing more important than this, right? While there are other metrics to track, this one definitely deserves your attention.

In short, this is the cumulative number of people that like your page. Breaking this down, pay close attention to your daily, weekly, and monthly growth.

Tip: Test out a Like Facebook ad campaign and see what happens. Facebook Ads expert Jon Loomer has a great article on how to get more Likes and Fans. At Dasheroo we have one constantly running so when we have something to announce we’ve built a big audience to talk to.

Shares

Posting content to Facebook is a good thing. Having this content shared by others is powerful.

You should track the shares of content on your page by day, week, and month. Just the same as fans, you want to experience positive growth. And shares are more powerful than likes since the content someone is sharing is actually displayed on their page.

And since someone doesn’t have to Like your page in order to share your content even better!

Facebook expert Mari Smith has a great infographic on how to increase Facebook Shares.

CommentsDasheroo Facebook Analytics Dashboard - Comments

Much the same as shares, this is an “engagement” metric. It shows that people are doing more than reading your content. They are also commenting, giving you valuable feedback that can help you generate a more targeted Facebook marketing strategy.

You want to know how many comments your page is receiving (daily, weekly, monthly).

Scott Ayers Co-author of Facebook All-In-One for Dummies tells you 4 types of posts that will get your more comments.

Likes

Likes have been driving the Facebook engine since day one. In the same mold as shares and comments, likes show that your audience is interested in what you’re saying.

A steady increase in likes shows that your audience is growing and your content is “sticking.”

Reach

Facebook marketing success is all about activity. You want to Dasheroo Facebook Analytics Dashboard - Reachreach as wide an audience as possible. Furthermore, you want to track your reach (also referred to as impressions).

With this metric, you can track the total number of people who could have seen any activity on your page, such as: posts by the page, posts by other people, page links, mentions (and more).

Final Word

With more than one billion daily active users, Facebook provides the opportunity to reach a humongous audience. You should have three goals in mind:

  • Reach as many people as possible.
  • Experience positive growth.
  • Track the appropriate metrics to pinpoint your successes, failures, and potential strategy changes.

P.S. Don’t forget to check out our free social media dashboard from Dasheroo. Track all of your important social media KPIs in one nifty spot!

Facebook Ads: Monitoring Your Cost Per Page Like

If you’re advertising on Facebook Ads (and you should look at it if you aren’t) you might be the type to “set it and forget it”. We know, we’ve been there. But just taking a quick peek at your Facebook Ads metrics in your Dasheroo data dashboard might make you think a bit more about how you do your Facebook advertising.

When you’re starting out you might start with one ad. Take for instance Dwight The Pup. He started out with under 100 likes and it was costing his owners .26 per like. Over time and as more people like his page, his cost per like has gone down to .21 per like with NO adjustments to the ad. And with 1609 clicks and 1376 Likes that’s coming in at a cool 85.5% conversion rate

Screen Shot 2015-02-22 at 11.20.53 AM

Then they did a test, they took two pics they liked with the same message. This one below got 23 clicks (not very valid) and 18 likes so a 78.2% conversion rate. They’ll keep a close eye on this for a few more days to see if Facebook gives this ad some love but .46 per like ain’t cuttin’ it.

Screen Shot 2015-02-22 at 11.13.59 AM

Now compare that to this ad below. Facebook is serving way more of it. out of 131 clicks they got 107 Likes, an 81.6% conversion rate. So far Image 1 seems to be working and .29 per like is getting closer to the winner.

Screen Shot 2015-02-22 at 11.14.15 AM

So in your biz you might consider creating a few ads; one with a person’s picture, one with a picture of your product and one with your logo. All of them should have the same message if you’re testing them head to head. Your call-to-action is asking people to “like” your Facebook page. This way when you have something to post (which hopefully is each day) your post will appear in your Fan’s streams. And if they like what you’ve posted their friends will see it and hopefully like it too.

Now you can compare your cost per page like to see who is bringing in the most Likes at the best price!

P.S. Don’t forget to check out your Ultimate Facebook Ads data dashboard at Dasheroo, you can track all of your social media analytics too!