Track your Facebook Ads analytics right within your Dasheroo data dashboard! Add key Facebook Ads insights and measure your KPIs in your real-time social media dashboard.
Available Facebook Ads Dashboard Insights
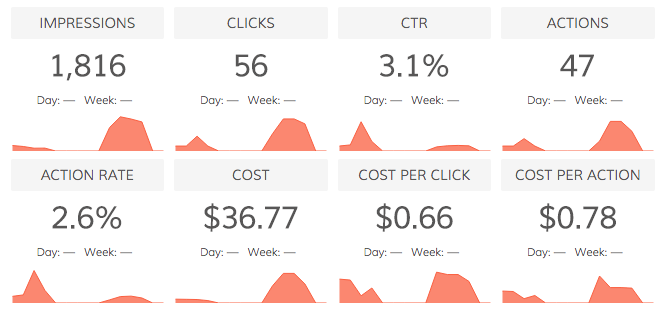
Overview
View the roll up performance summary for an Ad Account, Campaign, Ad Set or single Ad.
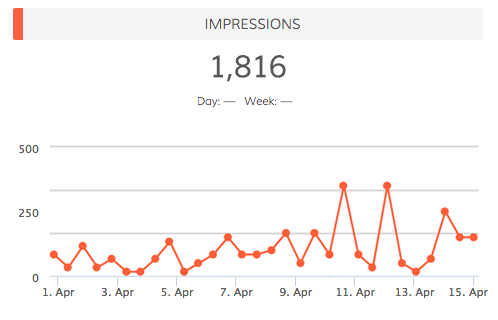
Impressions
View your ad impressions over time. Impression = total number of times your ad entered the screen for the first time
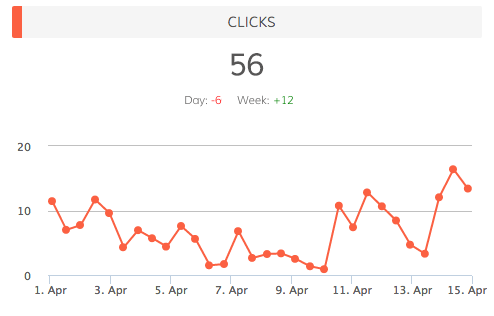
Clicks
View the total number of clicks on your ad over time. Depending on what you’re promoting, this can include Page likes, event responses or app installs.
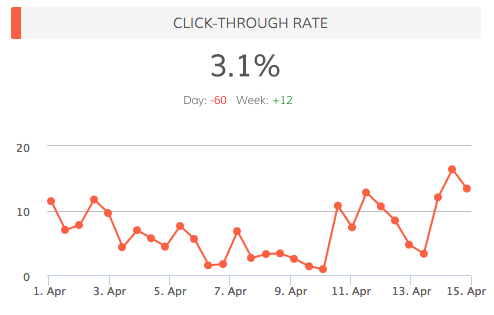
Click-Through Rate
View your click-through rates over time. CTR is all clicks ÷ by impressions in the date range.
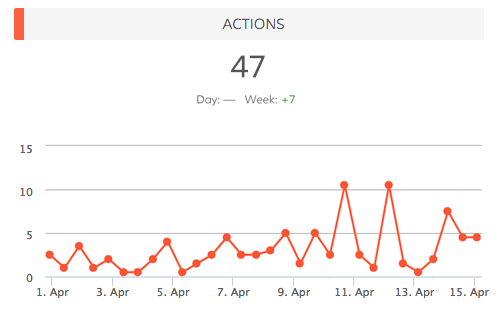
Actions
View the number of actions taken on your ad, Page, app or event after someone viewed your ad, even if they didn’t click on it. Actions include Page likes, app installs, conversions, event responses and more.
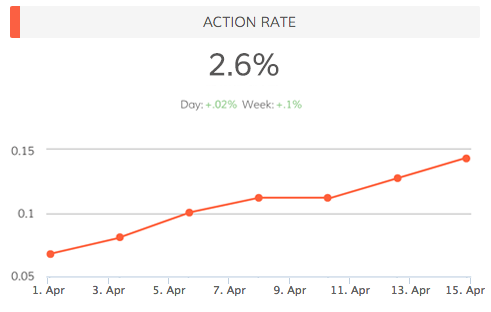
Action Rate
View your action rate for your ads over time. Action rate is all actions ÷ by impressions in the date range.
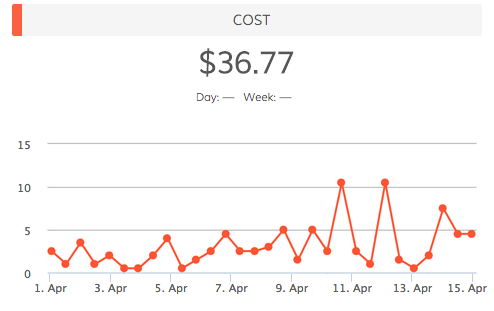
Cost
View your ad costs over time. Filter by Ad Account, Campaign, Ad Set or single Ad.
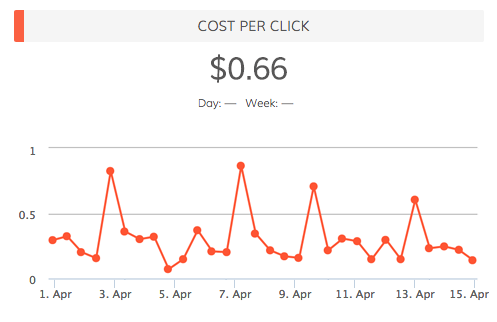
Cost per Click
View your cost per click over time. CPC = amount spent ÷ number of clicks for the ad.
Cost per Action
View your cost per action over time. Cost per Action = amount spent ÷ number of actions for the ad.
Highest Relevance Score
View the specific ads that generated the highest relevance scores.
Highest Click-Through Rate
View the specific ads that generated the highest click-through rate. CTR = number of clicks ÷ number of impressions.
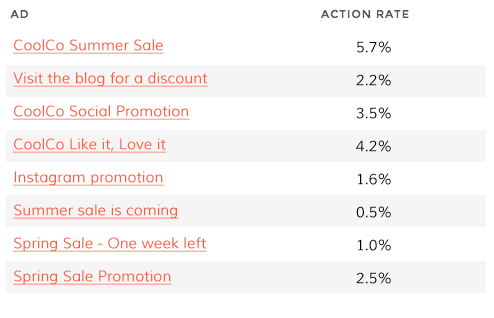
Highest Action Rate
View the specific ads that generated the highest actions rate. Action rate is all actions ÷ by impressions in the date range.
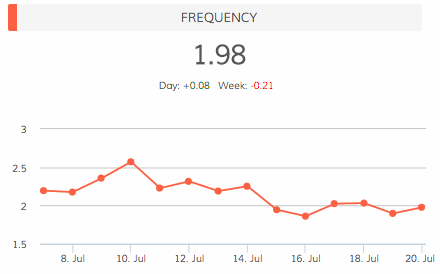
Frequency
View the average number of times your ad was served to each person.
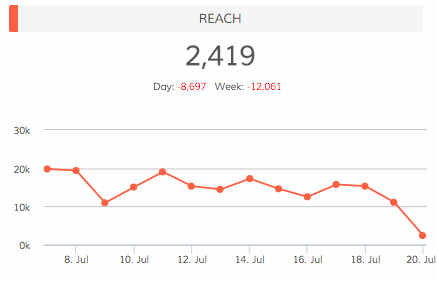
Reach
View the number of people who see your ad in a given time period and how it trends.
Actions by Type
View a trending line insight of a Facebook ad action in a given time period.
Cost per Action by Type
View a trending line insight that shows how the cost per Facebook action type trends over time.
Get Your Free Dasheroo Account!
- No limited-time trial periods — Dasheroo is FREE!
- No training or complicated implementation
- Quick set-up with ready to go dashboard templates
- Powerful, easy-to-use, and fun!