New Release: New Google Sheets Feature + QuickBooks Online!

We’ve been talking about it and it’s finally here! Check out all of the new insights and dashboards Dasheroo has to offer.

New to Google Sheets Dashboard

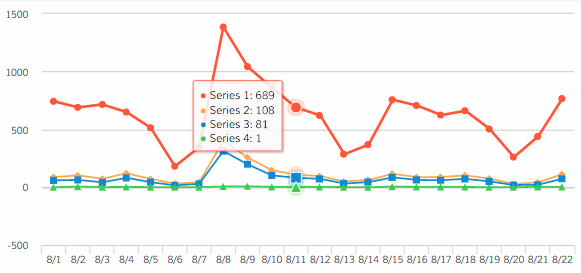
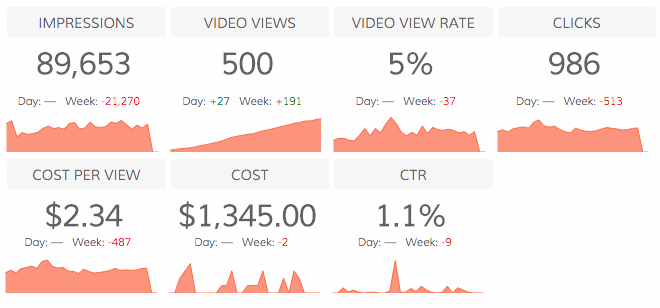
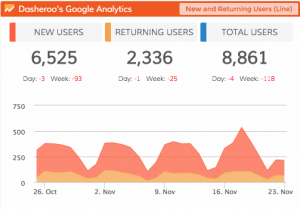
Now you can track multiple KPIs on ONE chart in your dashboard, up to 5 in fact. So if you want to see how one metric is performing right alongside others, this is the way to do it.

Google Sheets multi KPI dashboard

QuickBooks Online (QBO)

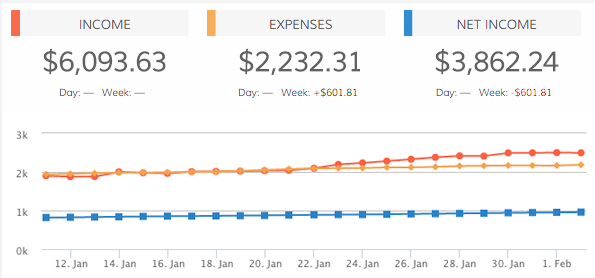
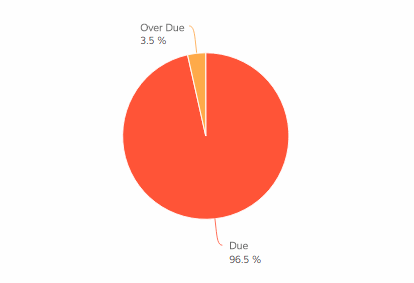
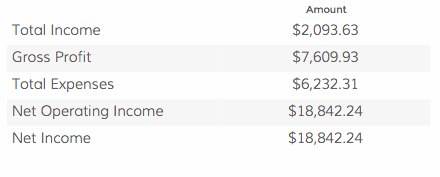
We familiarized ourselves with yet another integration that we think is strategically important, QuickBooks Online! After all it is one of the leading small business accounting software packages out there. We already show you what’s happening with Sales and Marketing on your dashboards from a myriad of integrations, but tracking money out and revenue in for marketing and sales is also important. So to start we’re giving you three insights from QuickBooks to add to your Dasheroo dashboard.

  • Profit and Loss – View a trending line of income and expenses for your business in the given time period.QBO Income and Expenses Dasheroo dashboard
  • Customer Balance – View the amount owed by your customers broken down by due and past due.QBO Past Due Dasheroo dashboard
  • Income and Expenses – View your high level profit and loss details for the given time period.QBO Income & Expenses dashboard

What’s New?

Ever wanted to know what we’ve been working on right from within the Dasheroo application? I know, sometimes you’re too busy to get yourself to the blog…well we’ll get you there! Just click on “What’s New” in the app and you’ll see exactly what we’ve been up to.

Dasheroo - What's New Feature

More to come!

Track Our Startup: We’re Almost There!

We’ve been talking about our latest software release for a few weeks now. This stuff for sure isn’t easy. You have to merge new code with your existing code without making it “visible” to users until you QA the crap out of it. And that’s what we’re in the midst of, making sure when we do make it visible to you it won’t break your dashboards.

So our awesome team had hopes that we could do that last week but it didn’t happen for a variety of reasons. And it would be more work to release part of it then then whole thing. So you might have to wait a few more days to see all of the awesome work we’ve been doing on Dasheroo.

Remember, we’ve got the ability to track up to five KPIs in a line chart using your Google Sheets dashboard. Pretty cool stuff. That’s the one I’m going to put to good use.

Sales & Marketing

Mimi, our Director of Sales, is working on closing one of our biggest deals yet and we’re pretty excited about it. It will bring us a lot of users which is always awesome. Great job Mimi!

I was recently looking at our YouTube analytics dashboard YouTube Analyticsand saw that we have a ton of views in the past week on Getting Started with Google Sheets. We try to have videos all over our help section of our website since we’re a pretty small team. In fact this particular video had almost 1500 views all time. That’s telling to us, we probably need more videos around using Google Sheets on your dashboards. Alf…..you’re so good at these ?

Are you looking at your YouTube analytics?

3 Things a Google Dashboard Can Teach You About Your Business

There is more to Google than its high powered search engine. Through the use of Google Analytics, you can gain a better understanding of your business.

With a Google dashboard in place, it’s easy to:

  • Track the data that’s most important to your business.
  • Understand your audience.
  • Make positive changes on the fly.

Taking this one step further, let’s examine three things a Google dashboard can teach you about your business:

1. Top Traffic Sources

Are you getting most your traffic from the search engines? How about social media? What about email marketing?

Once you setup a Google dashboard, you can answer all these questions in real time. Subsequently, you can adjust your approach to get the most out of each traffic source.

Dasheroo Google Dashboard Pages

For instance if you saw you were getting a ton of traffic from Organic Search (which you don’t pay for) then why not dig deeper to find out what keywords are driving your results and develop more content around those keywords.

If you see that referral sessions are driving a ton of traffic then dig in to see which referrals are converting the most.

2. Are You Reaching Your Goals?

One of the coolest features of Google Analytics is the ability to set and track goals. In short, this allows you to measure how often users complete a specific action, such as:

  • Destination
  • Duration
  • Event
  • Pages per session

Don’t shy away from setting goals related to website traffic. And if you’re going to do this, be sure to track your progress with a Google dashboard.

Dasheroo Google Dashboard: Google Goal Completions

Set a goal for how people sign up for your service or how many complete a sale. Then compare that to your sign up or sales data and make sure it all jives!

3. Most Popular Content

It’s imperative to understand the type of content that interests your audience. A Google dashboard can provide you with this insight. Here’s an example:

Screen Shot 2016-07-13 at 11.35.33 AM

These pages aren’t among our most popular, so we may want to think about updating them in the future to attract more visitors and better suit our audience.

Conversely digging into your popular pages may make you install a pop-up to get a user to join your list. You may want to include a popular product that a visitor buys along with the product on the page they’re visiting. This way you increase your average order size and ultimately your conversion rate.

When you understand what’s driving the most visitors to your site, you can use this to create more targeted content in the future.

Final Thoughts

Even if you’ve had great success without the use of a Google dashboard, don’t continue to put this on the back burner.

Regularly reviewing dashboard data can teach you a lot about your business.

P.S. If you’re looking for a Google dashboard provider, give us a try!

New Release: More Google Adwords Dashboard KPIs

We’ve been marching towards this release and it’s finally here! Thanks to everyone on the team for working hard on these upgrades that our users have been asking for. You’ll also be seeing more features over the next few weeks so stay tuned!

This week we’ve made some changes to our Google AdWords insights and wanted to provide all the details. If you use Google Adwords within Dasheroo you’ll want to check this out.

Google AdWords Enhancements

Ad PerformanceDasheroo Google Adwords KPIs

You’ll now view a table that provides your AdWords KPIs at an individual ad level. For every ad: clicks, impressions, CTR, average CPC and Cost are displayed as KPIs for the given time period.

Video Performance

The Video Performance insight is a quick snapshot of how your video ads are doing in the chosen time period. The overview insight shows high level stats like Impressions, Video Views, Video View Rate, Clicks, CPV, Cost, CTR. The insight also shows how these numbers have been trending in the given time period and gives you an indication of how your video ads have been doing.

Video Watch Rate

This multi-line insight will provide stats on the percentage of impressions where a viewer saw 25%, 50%, 75% and 100% of your video ad and how this trends over a period of time. This insight can be Dasheroo Google Video Views KPIsconfigured at an Ad Account, AdGroup, Campaign or individual ad level on your Google dashboard.

  • Watch 25% rate : Percentage of impressions where the viewer watched 25% of your video
  • Watch 50% rate : Percentage of impressions where the viewer watched 50% of your video
  • Watch 75% rate : Percentage of impressions where the viewer watched 70% of your video
  • Watch 100% rate : Percentage of impressions where the viewer watched 100% of your video

How cool is that? You’ll now be able to track video viewing KPIs on your dashboard.

New Filters

In addition to new insights we have now introduced the ability to configure your Google AdWords insight at the Ad Set, Ad Campaign or individual ad level. So in addition to the overall high level stats on your AdWords account, you can set up insights at a much granular level to see how a particular ad campaign or even an individual ad is performing. Simply add a new insight and configure it in the settings panel.

We’re planning on more releases in the coming weeks, happy dashboarding!

Google Webmaster Tools: Why We Love Google Keyword Planner

Here is how Google describes its super-awesome Keyword Planner tool:

“Plan your Search Network campaigns, get performance insights, and see keyword ideas.”

But there is more to it than that. There are many reasons why the entire Dasheroo team loves this tool (among other Google Webmaster Tools). Let’s dig into the finer details:

1. When We Want to Target a Keyword

We create content for our users, not for the search engines. Even so, it’s important to incorporate keywords every now and again. We aren’t opposed to free traffic, after all!

For example, plug-in the phrase “business dashboard” and here is what you get:

A search often leads to implementing a keyword we weren’t previously considering. In this case, maybe KPI dashboard makes more sense than business dashboard. Regardless, Google Keyword Planner points us in the right direction, allowing us to create more useful, search engine friendly content.

2. To See What Our Customers Want

There are many ways to determine what your customers want, including: directly asking for advice, using surveys, and reviewing traffic data.

You can also use Google Keyword Planner for this purpose, as you can see what potential customers are searching for.

Here is a simple three step process you can follow:

  • Search for a broad keyword.
  • Sort by average monthly searches.
  • Pinpoint the highest traffic keywords that best relate to your business.

The more searches a keyword receives the more interesting it might be to potential customers. This quick search can help you better understand your target market.

3. To Generate Additional Keyword Ideas

Research is a big part of a successful business. Even if you have a core list of keywords on which your business is built, it doesn’t mean you should stop there. We often use Google Keyword Planner to generate keyword ideas that can be used in future content.

Here’s a cool trick: search by URL instead of keyword. If you want to learn more about Dasheroo, for example, you would search “www.dasheroo.com.” Here are the results:

This allows us to see the keywords currently associated with our website, which puts us in position to uncover those we can implement in the future.

When it comes to the use of Google Webmaster Tools, Keyword Planner is one of our favorites and it’s FREE.

How have you used Keyword Planner in the past? Has it helped you generate positive results?

Track Our Startup: Dashboard Release Update + Awesome Mention!

We were talking about breaking up the next dashboard release we’ve been trying to push out into pieces so the parts that are ready can get to you and we can still keep working on the parts that aren’t. Unfortunately that actually becomes more work to re-test everything all over again so we’re staying the course! In the meantime we might be able to push a few features that were not part of this release to you…stay tuned.

Dasheroo dashboard of a spike in traffic

Our Dasheroo dashboard of the spike in traffic we got from Neil Patel’s blog mention!

Thanks to Neil Patel we got a huge spike in traffic from his article 7 Simple On-site Changes That’ll Increase Your Social MediaTraffic. And this is a great example of exactly what he’s talking about in his article, tracking!

If you don’t know who Neil is, crawl out from under the marketing rock from which you’ve been hanging and check him out. He’s got an amazing blog, he’s an awesome marketing consultant who founded amazing companies like Crazy Egg and KISSmetrics and he can help you get to the top of the rock with your keywords. Thanks for the shoutout Neil!

Speaking of SEO we’ve been pretty hard at work writing content for the keywords we want to be known for and it’s been working. We’ve been climbing for some pretty highly trafficked keywords like Google Dashboard and Twitter Analytics to name a few.

We’re reading for our monthly board meeting this week, but it’s kinda easy for us…why? Cuz we keep all of our continuously updated KPIs in … wait for it … A DASHBOARD!

Track Our Startup: Website Tests + Google Dashboard Features +

We released Notes this week and in case you missed it last week we released Hubspot! You test out this premium app free for a month with a code, check it out. It’s pretty cool to see your Hubspot KPIs alongside your social media and web analytics metrics.

Testing 1-2-3

Alf tested a long form vs. a short form sign up. Until now we’ve only asked for Company Name and an email address. Now we’re asking for more information and our users are giving it to us. It’s always better to know more about the type of customer we’re getting.

Dasheroo sign up form test dashboards

He’s also about to test some new headlines. More on that as we know more.

Dasheroo home page test - dashboards


Dasheroo Got Some Mentions!

We got on another great list in this podcast 7 Marketing Tools You Should Try This Week thanks Marketer’s Paradise! Jack Dean also posted Build your first Business Dashboard. And Janine wrote a great one for Inc.com, 5 Ways A Commute Can Kill Productivity. It really can can’t it?

Sales

Mimi our amazing salesperson closed one of our biggest deals ever this week. We’ll probably not mention who they are but boy are we excited and I thought it well-deserved a mention. Not to mention she’s closed the most deals ever in a month since we started!

Features; What’s Next?

On the product horizon we’ve switched gears a bit to focus on Google Apps integration where we’ll be pulling Dasheroo dashboards and insights into Google Drive. Right now we can give you dashboards FROM data in a Google Sheet, but this would be the other way around. Nifty huh? So not only will you be able to pull data from your Dasheroo Google Dashboard but any social media dashboard, sales dashboard or marketing dashboard you have!

For features in the more near term we’re working on scrolling insights so you can see the last 10, 25 or 50 items by scrolling.
  • Mailchimp: Recently Sent Emails
  • Twitter: Highest Engagement Tweets, Recent Tweets
  • Facebook: Recent Posts, Highest Engagement Posts
  • Instagram: Recent Posts, Highest Engagement Post

We’ve also been working on these additional insight types for Push API and after that Zapier, right now it’s a line graph only.

  • Bar Chart Insight
  • Leaderboard Insight
  • Pie Chart Insight
  • Funnel Chart Insight
  • Table Insight

The last thing we’re working on is the ability to schedule a recurring delivery of an exported dashboard!

We gotta get back to work!

Startup Lessons: How We Increased Our New Users Using Google Analytics

Google Analytics is a great tool, first of all it’s free, but it can really help to get through data, if you know how to use it. It’s great at helping you get through web analytics data and give you insight as to what to make changes to to improve your KPIs.

Dasheroo enables you to have your own Google dashboard because we make deciphering your Google Analytics data easy and thanks to that we were able to track our web analytics using our own tool, make some necessary changes and watch our user-base soar!

Look At Most Visited Pages

If you see a page (other than your obvious home page) that is getting a lot of traffic you could be capitalizing on this. For instance at Dasheroo the page What’s a Good Twitter Engagement Rate for Your Tweets was getting a ton of traffic. We found that it was #1 for the search term “Twitter engagement rate”. Who knew?

Dasheroo Google Dashboard

Test a Change

Because our goal is to write content like this to get people to sign up for our free dashboards we decided to “pump up the volume” by adding some promotional copy to the blog post.

Dasheroo Google dashboard: popup

Secondarily we decided to insert a pop up the relates to the content with a clear call to action. We used Popup Maker, a WordPress plugin. They even let you target the content of the popup for the specific page!

Measure It

We took a deeper dive into Google Analytics to see if what we did had an effect. Bonus? You bet. We more than doubled our sign ups to 364 from a mere 144. For real?

Dasheroo Google Analytics dashboard increase in traffic

So between January and September we were getting 16 sign-ups per month. From October to December we increased it to 73 sign-ups per month.

Next Up?

Our traffic continues to grow as we keep publishing some great content, so we’ll be optimizing all of our content not only for SEO but for our call-to-actions as well. We’ll continue to watch all of our most trafficked pages using Google Analytics on our Dasheroo Google Dashboard to see how we can optimize them not only on our blog but on our website as well.

Are you using Google Analytics for all that it can do?

P.S. Get your free Google Dashboard to track and view data from Google Analytics, Google Sheets and Google Adwords.

Google Dashboard: 3 Key Google Analytics Metrics to Track + Why

If you’ve created a Google Dashboard for all of your Google metrics, good for you! There are so many to keep track of like Google Analytics Goals, Google Sheets, Google Adwords, the list goes on.

The implementation of a Google Analytics dashboard allows you to do many things. While the primary goal is to learn more about your audience, it goes well beyond how many visitors your website generates on a daily (or weekly, monthly) basis.

Here are three key metrics to track (plus some advice on why it’s a good idea):

New and Returning Users by Number of Sessions

Dasheroo Google Dashboard: Google Analytics dashboardsHow many new users is your website attracting over a given period of time? What about returning users? By adding the two, you can also see the number of total users.

As the most basic metric in a Google Analytics dashboard, this shows how much progress your website is making (or not making) in terms of user visits.

Social Sources
Dasheroo Google Dashboard: Google Analytics Social Sources

You know by now that social media is a big deal. You have the ability to track performance related to each of your social profiles (such as through a Twitter dashboard), however, you should dig deeper.

Through your Google Analytics dashboard, you can see which social sources send the most traffic. You can then adjust your social media marketing strategy and budget accordingly.

Top Sources by Medium

Google dashboard: Google Analytics Traffic by Medium dashboardAll traffic is created equal, right? Well, not exactly. You want to know how people are finding your website. This is broken down into four distinct categories:

  • Direct Sessions
  • Organic Sessions
  • Paid Sessions
  • Referral Sessions

Within each category, you can view how much traffic it is responsible for as well as any growth or decline.

Final Thoughts

Google Analytics is more powerful than many people believe and should be a part of every business’s Google dashboard. Don’t get so caught up in the overall number of visitors that you overlook the finer details that have the biggest impact on your business.

P.S. Did you know you can have your own Google Dashboard right alongside all of your sales, marketing, e-commerce and social media marketing metrics? Finally one place to go for all of your KPIs. Best part? Dasheroo gets you up and running…FREE. Check it out.

Track Our Startup! Release: Pinterest Analytics & More Google Campaigns

We got Pinterest out into the wild, so if you’re an avid pinner for your business you’re going to love the Pinterest analytics we’re giving you to track on your dashboard. Check out all that we’re offering here! Along with Pinterest we were able to also release a bunch o’ awesome stuff:

New Email Marketing Dashboard InsightsDasheroo email marketing subscriber dashboard

Now you can track email subscriber growth for each list in your account for: Campaign Monitor, VerticalResponse, AWeber, Emma, Mailchimp, Constant Contact and Get Response.

New Google Analytics Campaign Insights

We dove back into Google Analytics and created a few more insights for Campaigns that users were asking for.

  • Top Keywords by Sessions Leaderboard – Bar charts tracks the different organic keywords and the revenue that these keywords brought in.
  • Top Campaigns by Sessions Leaderboard – Bar chart tracks your Google Analytics Campaigns by Sessions.
  • Top Keyword by Revenue Leaderboard – Bar chart that tracks the different organic keywords and the revenue that these keywords brought in.

We also fixed a few bugs that hopefully you didn’t see so I won’t list them!

What else is going on? Isn’t that enough? No.

So we’re in Austin today. So far the co-founders got together for the first part of the Mind Meld yesterdayRepublic of the Sandwich in Austin, today the whole team is together. We’re going to share a bunch of data with the team, then go out and have some fun in this amazing city. Watch out Austin, I’ll post some pix to Instagram. Love this town. Oh, Uchiko, here we come, that’s right, land-locked sushi, but it’s the best ever!

One more thing we’re pretty excited about on the food train, James went to school with the Thomas who started Republic of the Sandwich in Austin, yep, we got takeout. If you’re in Austin it’s awesome, check them out!

Janine wrote some killer articles for Inc.com this week, Want to Get to SEO Perfection? It’s Time to Revisit Your Keywords! and Stop Wasting Time-5 Important Tasks To Outsource to a Virtual Assistant.

We got amazing mentions in Bill Brelsford’s blog for his marketing consultancy Rebar Business Builders entitled Getting The Most Out of Your Dashboard and we’re pretty stoked about it. He’s a great person who knows more than a thing or two about helping business grow by analyzing business analytics. Thanks Bill!

Ok, time to get back to the meeting! – John