New Release: Why You Might Need a Push API to Track KPIs

Dasheroo Push API for tracking internal KPIs
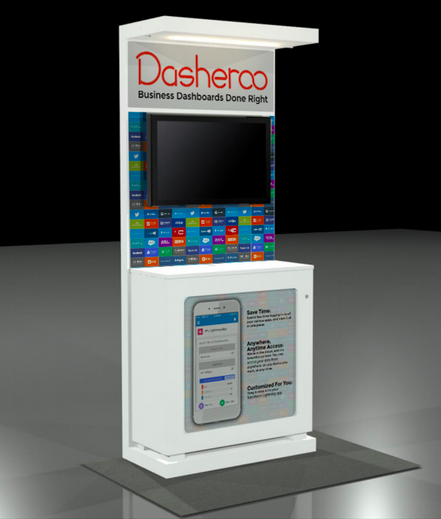
Ok, this won’t take too long to sink your teeth into why the Dasheroo Push API might be just the thing you need to keep track of ALL of your KPIs in one dashboard.

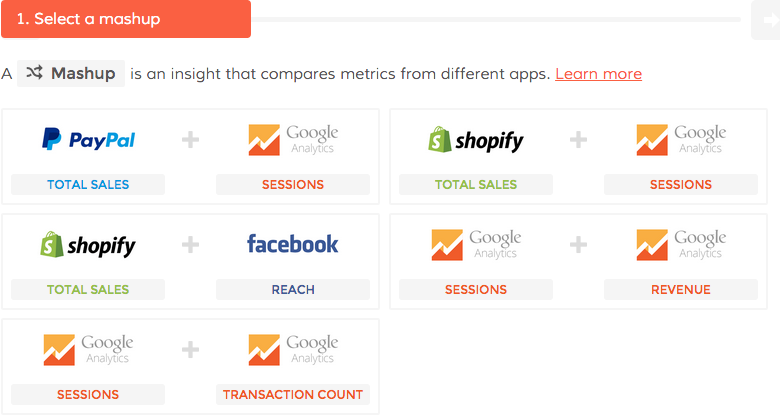
And if you’re a Dasheroo user we know you love using Dasheroo to connect to the dozens of apps we integrate with. But we know you might have other custom data that you also need to have visibility into on your dashboard. If so, the Dasheroo Push API can help out.

What’s a Push API?

Push API is a powerful way to connect any internal data to Dasheroo and convert your data into useful visualizations on your dashboard right alongside all of the other KPIs you’re tracking from Google Analytics, Facebook and perhaps Shopify!

So for instance you might want to track KPIs for:

  • Your internal sales system so you can see how any social media is working to drive sales
  • Your internal sales system so you can see if there are any discrepancies with your PayPal, Shopify, or Stripe sales.
  • Your number of new customers from your internal systems
  • Error tracking on your website or database

On top of this you want your stats updated FAST and furiously. And you can have your KPIs updated new (starting from 0) each day or have them continuously updated. Cool huh?

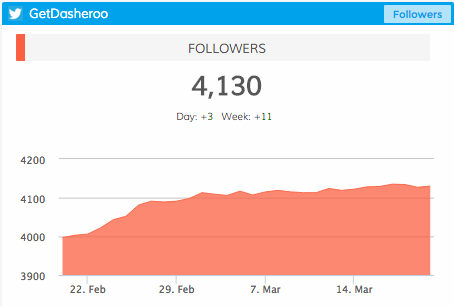
Currently Dasheroo has users users who’ve created dashboards that combine Push API insights with a selection of over 500 current insights we offer from 35 applications. But we also have users who’ve created Push API-only dashboards and are using Dasheroo as a pure visualization tool. Obviously we’re happy to support any and all users!

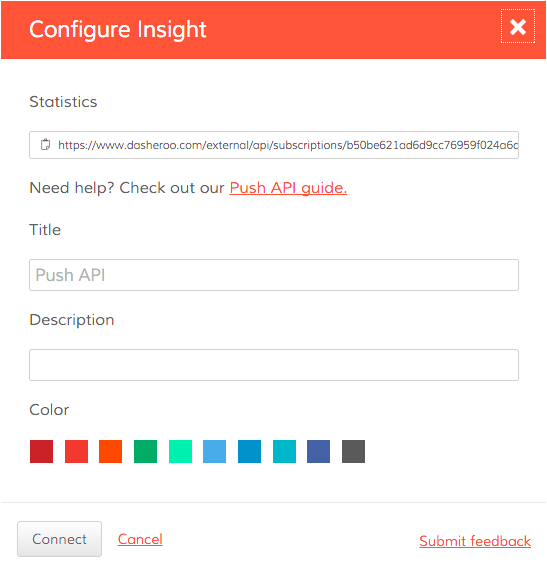
Setting up the Push API for your business is simple; all you need to do is send the data you want to visualize to a unique URL provided by Dasheroo and we will take care of the rest.

How to set up the Dasheroo Push API.

P.S. Looking for even more ways to get custom data into your dashboard? Check out our Zapier integration!

Startup Lessons Learned: SaaS Conversion Metrics

Ben Chestnut Sales funnel

We love Ben Chesnut’s (Mailchimp) reversed sales funnel!

We’re big into measurement here at Dasheroo. We use tools like Mixpanel, Optimizely, Google Analytics and our own businessdashboards to measure results and instrument improvements. This is particularly true in what we call the ‘auto-convert’ side of the house. These are the type of low ARPU users that we need to move through the conversion funnel without the need of sales assistance.

So I thought I’d share our current sales funnel metrics. First, as a business freemium model we do not pay for advertising! Our traffic is driven by inbound marketing – search engine optimization, lots of content marketing, an active social media presence and co-marketing with our partners like Salesforce, Infusionsoft and Shopify. Plus that great viral growth from positive word of mouth and just a great product.

Once these people visit our site, here’s how our conversion funnel stacks up:

  • 10.4% of users sign up for a free account. Yes, over 10%! That is amazing, as at other freemium businesses we’ve run we would have been thrilled to get 2-3%! And this isn’t just a blip, we have maintained this signup conversion rate for months.
  • 65% connect an application and create a dashboard (this is trending up, April was 70%). That means that healthy signup rate is also driving qualified users!
  • And that 65% connect & create their dashboard 2 minutes or less. Wow, that’s pretty fast.
  • 2.1% convert to a paid account. Our goal is 3%, so we have some work to do!
  • with a ‘DTP’ (Days to Pay) of 29 days (this is trending shorter; April was 26.5 days)
  • And an ARPU of $24.26

What’s important is to establish both what your SaaS conversion metrics are, and then set and measure against goals. At the very start of your SaaS business you may not know exactly what the goals should be, but you should definitely know what the conversion metrics are. Then measure and instrument your business to show month over month, or at least quarter over quarter gains. What are your metrics for your SaaS business, share them!

5 Metrics to Track for Your Beginner Marketing Dashboard

You may not be new to marketing, but the idea of using a marketing dashboard could be foreign. But don’t be scared. Don’t let a lack of knowledge keep you away from this game changing tool.

As you setup your beginner marketing dashboard and begin to use it to your advantage, pay close attention to the following five metrics.

1. Email Marketing List GrowthDasheroo data dashboard - list growth

With the opportunity to generate a large return on investment, email marketing should be a big part of what you do.

The size of your list at the present time is not nearly as important as its growth. Use your marketing dashboard to track the growth of your list, striving to increase sign-ups month over month.

And it doesn’t matter what email marketing platform you use, they’ll all give you this data.

2. Social Media Engagement

From Twitter to Facebook to Instagram, there is more to social media than posting updates dasheroo data dashboard: social media engagementand waiting for something good to happen. You need to implement a strategy that boosts engagement.

For instance with Facebook engagement includes:

  • Liked
  • Shared
  • Commented
  • Clicked

Make sure your charts are going up and to the right and if it isn’t dig in and find out why!

3. Google Analytics UsersDasheroo data dashboard: Google Anaytics userss

Traffic, traffic, traffic. A big part of your online success is based on your ability to drive users to your website.

Sync your new marketing dashboard with your Google Analytics account to track users. This shows if your traffic is increasing or decreasing, while also lending data on how visitors are finding your website.

4. Social Media FollowersDasheroo data dashboard: Twitter Followers
Much the same as social media engagement, it’s important to understand how many people are following you on social media. Is your reach growing?

From day to day, from month to month, you can track your number of followers on each social platform. Positive movement is what you are looking for.

5. Ecommerce

Are you selling a product (or products) online? If so, accurate data can be the difference between success and failure. A marketing dashboard can help Dasheroo data dashboard: Ecommerceanswer questions such as:

  • Where are consumers coming from?
  • How much time are consumers spending on your website?
  • How many items are they buying at a time?
  • How much is the average consumer spending?

Whether you use Shopify, Infusionsoft, Hubspot, Stripe or Paypal you can easily access this data!

Experiment and Adjust

Your beginner marketing dashboard will not look the same for long. Once you understand what you can track, once you understand how this impacts your business, you can then begin to make changes.

The most important thing right now is getting started. Sign up for Dasheroo to learn more, it’s free!

7 Tools That Can Help You Rapidly Grow and Automate Your Business

Entrepreneur.com logoDasheroo was listed as one of these 7 awesome tools for SMBs on Entrepreneur last week and we couldn’t be happier. A notable quote? “It’s brilliant for the busy entrepreneur who wants it all in one place.” Perfect!

We share the spotlight with greats like Infusionsoft, Shopify, Clearvoice, Printful, Clickfunnel and SproutSocial!

We’ve even got an integration so you can get a Shopify sales dashboard right within Dasheroo, Infusionsoft is coming!

Check out the article, it’s great and thank you to the great Matthew Toren for including us! He’s a serial entrepreneur, mentor, investor and co-founder of YoungEntrepreneur.com. He is co-author, with his brother Adam, of Kidpreneurs! Check him out for sure.

Nice Press for Dasheroo!

We like to let you know about any cool PR Dasheroo gets from time to time, so without further adieu here are some really cool mentions about us in the past few weeks.

Heinz Marketing - App of the Week.Heinz Marketing – Matt Heinz knows a thing or three about B2B marketing as CEO of Heinz Marketing and renowned author! Dasheroo got “Matt’s App of the Week“, thanks Matt!

Website Magazine – These guys picked up on the fact that we have ecommerce & sales dashboards for PayPal, Website Magazine - Dasheroo's new sales dashboardShopify, Stripe and Google Analytics Ecommerce.

Thanks for the mentions!

New Release! Google Analytics Goals + Killer Mashups

Dasheroo Google Analytics Goals Dashboard

Dasheroo’s new Google Analytics Goals dashboard. We’re tracking our own conversion rate to sign up!

In an effort to go deeper into current integrations we have for our data dashboards we’ve got an awesome release for your Google dashboard. We just released Google Analytics ecommerce dashboards and now we’re excited to announce we released Google Analytics Goals for you to track. Here are the new insights you can connect to your Dasheroo data dashboard in no time!

  • Goal by Source – View the conversion rate for a Goal by a given Source and how it trends in the given time period. According to Google Source means every referral to a web site has an origin, or source. Possible sources include: “google” (the name of a search engine), “facebook.com” (the name of a referring site), “spring_newsletter” (the name of one of your newsletters), and “direct” (users that typed your URL directly into their browser, or who had bookmarked your site).
  • Goal by Medium – View the conversion rate for a Goal by a selected Medium in the given time period. According to Google, Medium is every referral to a website also has a medium. Possible medium include: “organic” (unpaid search), “cpc” (cost per click, i.e. paid search), “referral” (referral), “email” (the name of a custom medium you have created), “none” (direct traffic has a medium of “none”).
  • Goal performance by Source/Medium – View the conversion rate for a Goal by a selected combination of both Source and Medium and how it trends in the given time period. It’s great to combine both source and medium so you can have them all in a single menu to choose from.
  • Goal performance – View the conversion rate of a selected goal and how it is trending in the given time period.
  • Goal comparison – View a pie chart comparing goal completions of the different goals in your Google Analytics account.
  • Goal completions vs. Goal abandons – View a pie chart comparing the Goal Completion Rate and Goal Abandonment Rate for a particular Goal.

Dasheroo Sales Dashboard mashupsWe’ve also added FIVE spectacular mashups to the mix for your Sales pleasure!

  • Google Analytics Sessions vs. Google Analytics Revenue
  • Google Analytics Sessions vs. Google Analytics Transactions
  • Google Analytics Sessions vs. PayPal Sales
  • Google Analytics Sessions vs. Shopify Sales
  • Facebook Reach vs. Shopify Sales

Now get in there and add all of these great new insights to your data dashboard!


Track Our Startup: New Release! Shopify + Google Analytics Ecommerce Dashboard

Dasheroo's Google Analytics Ecommerce Dashboard

Our own Google Analytics Ecommerce dashboard, get one for yourself!

We’re releasing so many features and integrations so fast we can’t even keep up! Anyhoo, it’s true, we just released Google Analytics Ecommerce and Shopify dashboards to get closer to rounding out a payments/ecommerce dashboard suite (with Stripe and PayPal dashboards already in the wild and Shopify on deck.) We really need your feedback on these integrations if you use these products, we’re always looking at making them better.Dasheroo's footwear choice for Dreamforce: Converse Chuck Taylors, orange of course.

Just 7 short days to Dreamforce (#DF15), Salesforce’s annual event here in San Francisco. If you see someone wearing these Chucks ->, chances are they could be on team Dasheroo so stop us and say hi!

Josh and I are practicing our dry run this week for our demo at 8am (early!) on September 16th, since Dreamforce is free I’m sure you’re all going to be there rooting us on, right? Please? Hello out there?

I just saw Nivi put out a note on Basecamp about a hashtag dashboard, how cool is that?? We still have competitor dashboards we’re working on and Google Campaigns and Goals are in the works. Like I said, gettin’ hard to keep up, our product and engineering teams are awesome!

Alf and Jenny have been working hard at diving into Customer Success to make sure that at every decision point a user has, the path we’re offering them to take, just makes sense. Customer experience is our #1 focus, if that doesn’t work, we won’t be set up for success.

JP and I have been working on a marketing plan for the rest of the year. With so many moving parts we have to nail down who is doing what. Janine has been busy getting some marketing help from people to help us write. This should really help with our SEO efforts.

Finally I’ve been gathering information to start talking to folks about a B-Round investment. Our amazing Series A round folks CloudApps just launched their own company with an oversubscribed round and we need to make ’em proud by going aggressively after a B round which means kicking in the growth machine.

New Release: Your Shopify Dashboard Is Here!

Dasheroo Shopify Dashboard
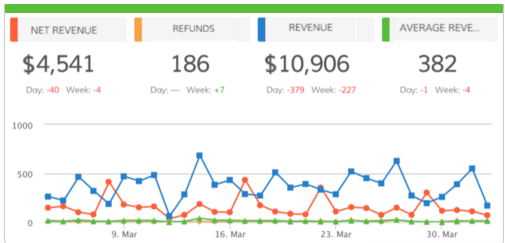
We’ve been working hard on rounding out our billing-payments-ecommerce dashboards for those of you who have been asking about tracking these metrics on your Dasheroo business dashboards. Makes sense right? Who wouldn’t want to see their marketing dollars well spent on how much money is coming in the door.

So without further adieu, here is what you can now see in your awesome Shopify dashboard!

Sales over time

  • Trending insight of sales per day over the given time period represented as a line graph
  • Average & Median Sale value by cart

Orders over time

  • Trending insight of orders per day over the given time period represented as a line graph

Recent Activity

  • Most recent sales from your storefront with the appropriate status represented as a table

Most Sales

  • Transactions ranked in the order of $ sales, highest to lowest in the given time period represented as a table

Refunds Over Time

  • Trending insight of refunds per day over the given time period
  • Total refunds and total $ amount in refunds are represented as a line graph

Orders Received vs Fulfilled

  • This is an insight that will compare the number of orders to the number of orders fulfilled in the given time period represented as a pie chart
  • This tells you of all of your orders, how many remain to be fulfilled and the rate at which you are fulfilling orders

Orders vs Abandoned Checkout

  • This is an Insight that will compare the number of orders to the number of checkouts that were abandoned represented as a pie chart

Top Products

  • Leaderboard of the products that contributed most to the revenue in the given time period represented as a table

Customers Over Time

  • This is a trending insight of customers the storefront has acquired per day over the given time period represented as a line graph.
  • Total number of customers and total revenue

Sales by New and Repeat Customers

  • This insight compares the sales generated by new and returning customers in Shopify represented as a pie chart

Top Customers

  • Leaderboard of customers that generated most sales in the given time period represented as table

Top Sources

  • This is a leaderboard of traffic sources that contributed to maximum sales represented as a line graph
  • Traffic source include direct, referral , social, search engine represented as a table

Ok! If you use Shopify we’d love to hear your thoughts on what’s great, what’s not and what you need!

Track Our Startup: Dreamforce ’15 Countdown is ON

We’re in release heaven here in Dasheroo. In just a month we’ve released PayPal, Stripe, an iOS app plus a TON of under-the-hood much needed stuff that you don’t see but it makes the expectation you have the things should just work, happen.

Dasheroo's Dreamforce booth 2015.15 Days to Dreamforce 15 (#DF15)

We selected our booth (ok “pod”) right next to MixPanel and VistaPrint at Salesforce.com’s annual event here in San Francisco! And you can bet we’re wearing our orange! We’ll be demoing something pretty nifty at DF15 so stop by if you’re there. You can get free expo hall passes here we’re told.

Upcoming Dashboards and Insights

We’re hoping to add to our ecommerce-billing-payments dashboards with a Shopify dashboard in the coming weeks. So those of you selling stuff and using this great tool for your shopping cart will be able to see your metrics.

We’re diving back into our Google Analytics Dashboards and coming up with insights for Google Analytics E-commerce Insights. We’re sticking with the question “how much am I making off of my marketing” dashboards. Following onto that will be Google Analytics Campaigns and Goals insights. Now you’ll be able to see right from Dasheroo if all of those efforts you’ve been working on are paying off in terms of sign ups or cold hard cash!

My new scintillating business.com article is out entitled Who Are You? Why Ignoring Your About Page is a Terrible Idea and Janine wrote her new Inc.com article, 3 Ways to Move Your SEO Needle.

Talk to you in a week for more of your business analytics updates!