We make it pretty easy to spot trends on your Dasheroo data dashboard. Then you can drill into the native application to get more data. The more insights you have on your dashboards, the more data you have at your fingertips to spot these trends.
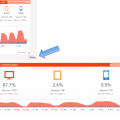
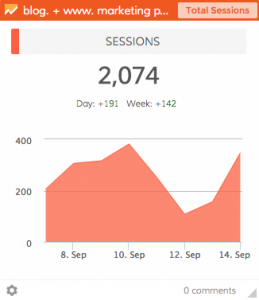
We look at our KPIs (Key Performance Indicators) side by side on our dashboards. In this particular dashboard in a given time period you see that on September 10 we got a spike in Google Sessions.
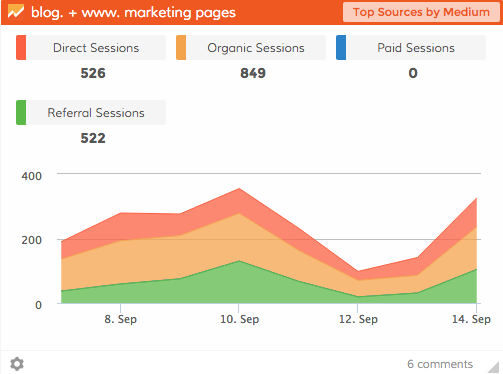
Then we looked at the next insight on our dashboard and we saw Referral traffic (in green) had a little spike too.
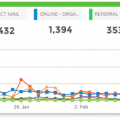
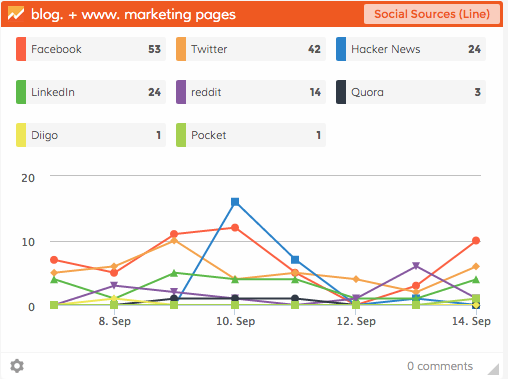
Finally our eyes went over to our Social Sources insight and voila, Hacker News is the culprit!
So it’s pretty easy to see some correlating data just using your Dasheroo data dashboard.