New Release: Your Shopify Dashboard Is Here!

Dasheroo Shopify Dashboard
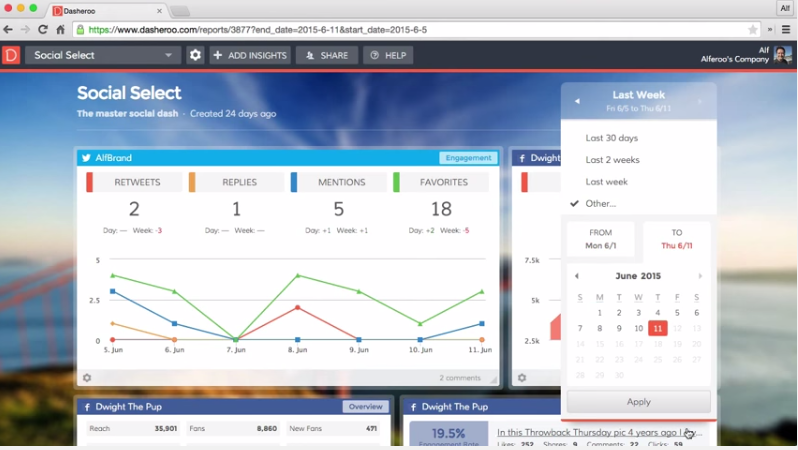
We’ve been working hard on rounding out our billing-payments-ecommerce dashboards for those of you who have been asking about tracking these metrics on your Dasheroo business dashboards. Makes sense right? Who wouldn’t want to see their marketing dollars well spent on how much money is coming in the door.

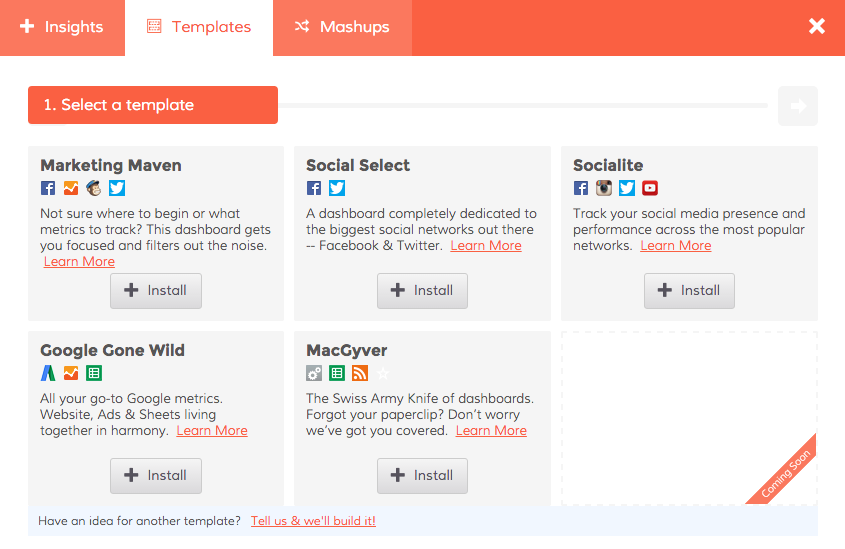
So without further adieu, here is what you can now see in your awesome Shopify dashboard!

Sales over time

  • Trending insight of sales per day over the given time period represented as a line graph
  • Average & Median Sale value by cart

Orders over time

  • Trending insight of orders per day over the given time period represented as a line graph

Recent Activity

  • Most recent sales from your storefront with the appropriate status represented as a table
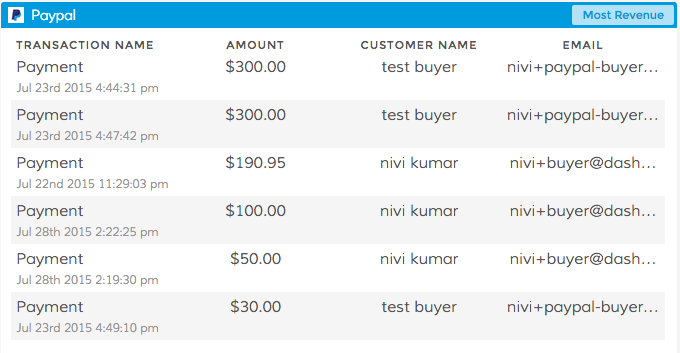
Most Sales

  • Transactions ranked in the order of $ sales, highest to lowest in the given time period represented as a table

Refunds Over Time

  • Trending insight of refunds per day over the given time period
  • Total refunds and total $ amount in refunds are represented as a line graph

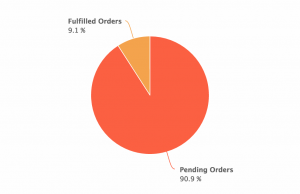
Orders Received vs Fulfilled

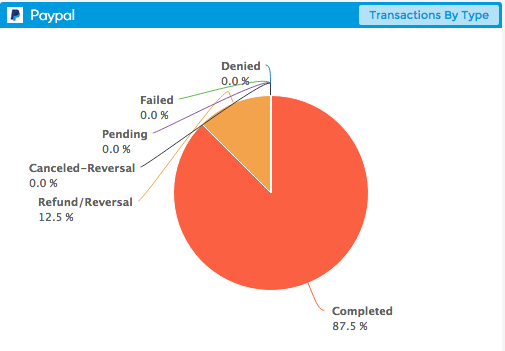
  • This is an insight that will compare the number of orders to the number of orders fulfilled in the given time period represented as a pie chart
  • This tells you of all of your orders, how many remain to be fulfilled and the rate at which you are fulfilling orders

Orders vs Abandoned Checkout

  • This is an Insight that will compare the number of orders to the number of checkouts that were abandoned represented as a pie chart

Top Products

  • Leaderboard of the products that contributed most to the revenue in the given time period represented as a table

Customers Over Time

  • This is a trending insight of customers the storefront has acquired per day over the given time period represented as a line graph.
  • Total number of customers and total revenue

Sales by New and Repeat Customers

  • This insight compares the sales generated by new and returning customers in Shopify represented as a pie chart

Top Customers

  • Leaderboard of customers that generated most sales in the given time period represented as table

Top Sources

  • This is a leaderboard of traffic sources that contributed to maximum sales represented as a line graph
  • Traffic source include direct, referral , social, search engine represented as a table

Ok! If you use Shopify we’d love to hear your thoughts on what’s great, what’s not and what you need!
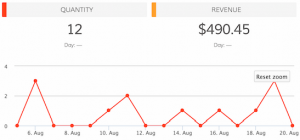
New Release: Google Analytics Ecommerce Dashboard

Many of you have been asking about tracking your ecommerce metrics in your Dasheroo business dashboards. So we’ve been working hard to provide you with PayPal and Stripe which have been released and now we get to add to that with a Google Analytics Ecommerce dashboard.

Here’s what you’ll get:

Dasheroo's Google Analytics Ecommerce DashboardRevenue

  • Trending insight of revenue per day over time for the given time period.
  • Stats like total revenue, average revenue per order, conversion rate & number transactions

Top Products

  • Leaderboard insight listing the products that generated the most revenue by product name
  • A tabular insight

Conversion Rate

  • Trending insight of conversion rate for your storefront.This is the percent of visits in Google Analytics that resulted in an ecommerce transaction
  • Total conversion rate for the time period and the total number of transactions in the specified period of time

Recent Transactions

  • Tabular insight of the most recent transactions in your storefront during the given time period. This will include the transaction details like amount, customer details and date.

Revenue by Source

  • Breakdown of your revenue by source represented as a bar graph

Revenue by Medium

  • Breakdown of your revenue by medium represented as a bar graph

Revenue by product category

  • Leaderboard insight listing the product categories that generated the most revenue represented as a tabular insight

Revenue by Product SKU

  • Leaderboard insight listing the product categories that generated the most revenu represented as a tabular insight

Quantity

  • Trending insight of the number of units sold by your storefront in the given time period.
  • Total quantity sold and total revenue are metrics shown in the insight.

Best Selling Days

  • Leaderboard insight of days when your storefront made the most revenue represented as a tabular insight with date and $ amount of revenue.

Mashups

  • Transactions vs Sessions
  • Revenue vs Sessions
  • Revenue vs Transactions

So if you’re in the business of selling, you can have your own Google Analytics ecommerce dashboard!

VIDEO: Set Up a Dashboard Using Dasheroo Dashboard Templates

If you haven’t seen our dashboard templates in action yet you won’t believe your eyes! You can have a complete dashboard depending on what metrics you want to start with in minutes using our templates. Alf is here to tell you just how, in a 1-minute 45-second video.

VIDEO: How to use Dasheroo's business dashboard templates.

Check out our other amazing videos…

Track Our Startup: Dreamforce ’15 Countdown is ON

We’re in release heaven here in Dasheroo. In just a month we’ve released PayPal, Stripe, an iOS app plus a TON of under-the-hood much needed stuff that you don’t see but it makes the expectation you have the things should just work, happen.

Dasheroo's Dreamforce booth 2015.15 Days to Dreamforce 15 (#DF15)

We selected our booth (ok “pod”) right next to MixPanel and VistaPrint at Salesforce.com’s annual event here in San Francisco! And you can bet we’re wearing our orange! We’ll be demoing something pretty nifty at DF15 so stop by if you’re there. You can get free expo hall passes here we’re told.

Upcoming Dashboards and Insights

We’re hoping to add to our ecommerce-billing-payments dashboards with a Shopify dashboard in the coming weeks. So those of you selling stuff and using this great tool for your shopping cart will be able to see your metrics.

We’re diving back into our Google Analytics Dashboards and coming up with insights for Google Analytics E-commerce Insights. We’re sticking with the question “how much am I making off of my marketing” dashboards. Following onto that will be Google Analytics Campaigns and Goals insights. Now you’ll be able to see right from Dasheroo if all of those efforts you’ve been working on are paying off in terms of sign ups or cold hard cash!

My new scintillating business.com article is out entitled Who Are You? Why Ignoring Your About Page is a Terrible Idea and Janine wrote her new Inc.com article, 3 Ways to Move Your SEO Needle.

Talk to you in a week for more of your business analytics updates!

VIDEO: Commenting & Collaboration With Your Dasheroo Business Dashboard

If you work on a team and you’re all tracking metrics this feature is for you! Dasheroo offers the ability to comment on an insight or on a dashboard. Perhaps you see a huge spike in your Google Analytics dashboard and you don’t know why? Simply add a comment to the insight that shows the spike and anyone who your dashboard is shared with will get an email. They can click to respond directly on that email. Super easy and super cool. Let’s watch Alf’s 1 minute 13 second video!

Commenting and collaborating on a Dasheroo business dashboard.

Don’t miss our other videos:

New Release: Free iOS Business Dashboard Mobile App

Yep, wDasheroo's mobile app for business dashboard
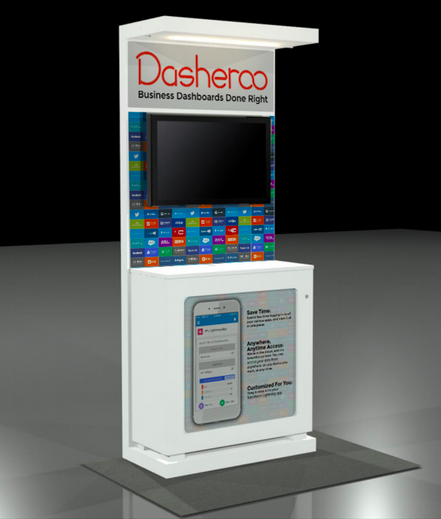
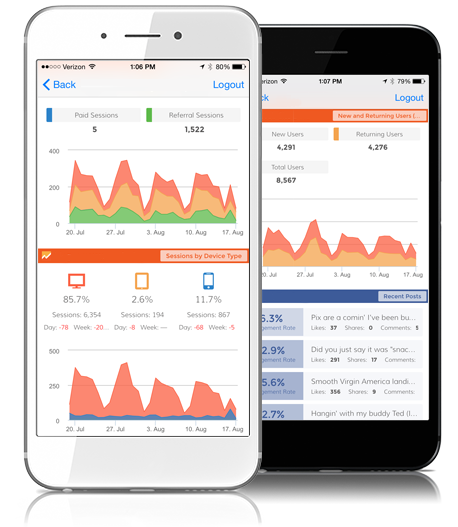
e’ve been talking about it for a long time and it’s finally here. You’ll be able to easily scroll through your Dasheroo business dashboard on your iPhone with our iOs mobile app! No more fat-fingering your insights all around only to find that you’ve pissed off the marketing person and moved all of her insights all over the place! Nope, just simply choose your dashboard and you’ve got all of your data in an easy to read format, on the go!

So head on over to the Apple store and get your Dasheroo mobile app free!

Track Our Startup: SIX New Projects We’re Working On!

You can get your very own Stripe and PayPal payments dashboard at Dasheroo now! Go check them out if you use these payment solutions for your business, it’s pretty cool to see your these metrics next to your Google Analytics dashboard or your social media dashboard.

Here’s what we’ve been working on for your future Dasheroo business dashboard:

  • Josh submitted our iOS app to Apple and we’re in QA with our Android app. I won’t talk about it again until we launch!
  • Alex has been working on OAuth. This is simply a way for us to easily integrate with a ton of 3rd party applications like the ones you have on your dashboards. This also enables a top-secret integration with Salesforce.com too, more on that soon!
  • Andrew has been working on the “scaffolding” for our agency & partner admin console. If you’re an agency you want some controls over your client’s dashboards and you want to be able to easily log in and out of them from one spot.
  • James has been working on responsive design for our dashboards and Court has been busy in QA with it. This is great for integrations but also enables our dashboards to look nifty on tablets and mobile devices.
  • Competitor Dashboard – Nivi and team have been making great progress on this new dashboard template so that once James (he went to Alaska!) is back, he can assess when we can take the competitor dashboard live. You’ll be able to select this feature right from the dashboard templates to compare how you’re doing with a few metrics to how your competition is doing.
  • Dreamforce - Foo Fighters

    Do you think the Foo Fighters need a business dashboard? We do!

    OK, that’s a ton of stuff in flight!

But Wait There’s More…

We’ve decided to sponsor Dreamforce! Like we said Alex has been working on a super-secret Salesforce project and you’ll get to see it at this amazing annual event. John and Josh will also be speaking on how we did it and show you.

We’ve just had our first request for a non-profit pricing program. We were so successful with it at our last company it makes total sense. Plus we really love helping those who save people, animals and the environment, everyone should huh? Janine is taking on getting this project together since she worked it at VerticalResponse. More on that as it unfolds but it’s slightly complicated.

Back Office

We don’t have a policy for vacations here, pretty cool huh? We just work off of the “Get your sh*t done” policy. So I talked to our legal team this week who blessed a non-policy policy, for now it works for all of us so hopefully it continues to!

John at Dasheroo

P.S. I hate accounting.

VIDEO: Custom Date Ranges for Your Business Dashboard

Alf does a great job at getting all of our “how-to” videos up in our Dasheroo YouTube Channel. Plus he’s got such a fine and friendly voice, doesn’t he? If you haven’t heard him, watch this 1-minute 17-second video on how to find custom date ranges in your Dasheroo business dashboard.

Dasheroo custom-date-range feature VIDEO

Other videos you need to watch, and they’re short too!

Free PayPal Dashboards Just Released!

Dasheroo's Transaction By Type PayPal Dashboard

Dasheroo’s Transaction By Type PayPal Dashboard.

In an effort to get billing dashboards out to the masses we are super excited to announce that we’ve just released PayPal Dashboards! A large number of you have been requesting this for some time so we thought it was pretty important to get this out to you. Without further adieu here are the insights you’ll be able to add to your Dasheroo business dashboards to rock and roll your business.

Product Leaderboard – View the products you sell the most in a given time period

Transactions by Type -Transactions in PayPal can have many different statuses. This insight shows the different types of PayPal transactions in your account including completed, failed, refunded, pending , cancelled reversal etc.

PayPal Fees – Paypal charges you a certain fee so that you can accept payments and use their services. This trending line graph shows you how much you spend in PayPal fees in a given time period.

Refunds – Refunds issued by your PayPal merchant account are represented as a trending line graph in this insight. This gives you an overview of how many refunds you have issued and whether it is trending up or down.

Dasheroo's Most Revenue PayPal dashboard insight

Dasheroo’s Most Revenue PayPal dashboard insight.

Most Revenue – This insight shows a list of transactions in your PayPal account that contributed to the most revenue in the given time period. This helps you identify transactions that make the most money for your business.

Most Recent Transactions – The most recent transactions in your PayPal account are listed in a tabular format. Apart from the name of the transaction, details like the $ amount, fees charged by PayPal for the transaction, the net amount, status and the total balance remaining in your PayPal account at the end of that transaction are all listed.

Revenue – The most recent transactions in your PayPal account are listed in a tabular format. Apart from the name of the transaction, details like the $ amount, fees charged by PayPal for the transaction, the net amount, status and the total balance remaining in your PayPal account at the end of that transaction are all listed.

However you use PayPal you’ll be able to track your revenue and as always your feedback is hugely appreciated so tell us what we could be doing better!

Google Gone Wild: Meet Your New Google Dashboard

We’ve talked about the Marketing Maven dashboard and the Socialite dashboard template but have you heard about the Google Gone Wild dashboard template? It’s awesome and gives you one place to go to, to give you the perfect Google dashboard for Google Analytics, Google Adwords and Google Sheets all in one place. Enough Google?

First go to Add Insight in the top navigation bar of your Dasheroo account.

"Add Insights" button for Dasheroo business dashboards

Click on Templates and choose Google Gone Wild.

Dasheroo's Google Gone Wild Dashboard template

Connect your accounts for Google Adwords, Google Analytics and Google Sheets.

Connect your Google accounts in your Dasheroo dashboard

And you’ve got yourself one great Google dashboard in just a few minutes.

Dasheroo Google Dashboard

Of course you can customize it to your liking by adding other applications or Google Insights that we didn’t include in the template but we think it’s a pretty cool way to look at as much Google as possible. One more thing, you can expect more Google products and insights in this dashboard coming soon!

Is there too much Google, really?