• 카지노사이트
  • 파워볼사이트
  • 슬롯사이트
  • 토토사이트
  • 회사
    • 회사 소개
    • 우리의 이야기
    • 파트너
    • Press
  • 블로그

Dasheroo Blog

Business Dashboards Done Right

Search the blog

Recent Posts

  • Will These Stats Change Your Social Media Strategy?
  • How Do You Measure the Success of Your Instagram Marketing Plan?
  • A Social Media Dashboard Can Help Address Client Questions
  • Use Stripe Dashboard Insights to Stay Informed
  • Impress Agency Clients with a Social Media Dashboard

Categories

  • Agencies
  • Billing Dashboard Features
  • Business Dashboard Features
  • Business Data
  • Dasheroo Case Studies
  • Dasheroo for Agencies
  • Dasheroo for Salesforce.com
  • Dasheroo Press
  • Data Dashboard Features
  • Data Visualization
  • Facebook
  • Google AdWords
  • Google Analytics Dashboard
  • Google Dashboard Features
  • Instagram
  • KPIs
  • LinkedIn
  • MailChimp Dashboard
  • Marketing Dashboard Features
  • New Features
  • Partner Spotlight
  • Pinterest
  • Sales Dashboard
  • Shopify
  • Social Media
  • Social Media Dashboard Features
  • Startup Lessons Learned
  • Stripe
  • Twitter Dashboard
  • Uncategorized
  • Weekly Progress
  • Who Charted?
  • YouTube

Tag: Instagram engagement

New Release: Support for Facebook Business Manager + More

July 19, 2016 by Janine Popick·0 Comments

The summer hasn’t slowed down the Dasherooers! We’ve got new Facebook Ads insights for your dashboard and we now support Facebook Business Manager. We’ve also corrected our Instagram engagement insight to better reflect the correct engagement % as Instagram defines it.

New Support for Facebook Business Manager + Filtering!

We now support Facebook Business Manager in our Facebook Ads dashboard. In addition, Facebook Ads insights can now be filtered by ad set, campaign and the individual ad. All insights both existing and new have these new settings in the settings panel.

New Facebook Ads Insights

In addition to filtering, we have these 4 new awesome insights:Dasheroo Facebook Ads Frequency

Frequency – View the average number of times your ad was served to each person.

Actions by Type – View a trending line insight of a Facebook ad action in a given time period.
Cost per Action – View a trending line insight that shows how the cost per Facebook action type trends over time.

Reach – View the number of people who Screen Shot 2016-07-20 at 11.17.15 AMsee your ad in a given time period and how it trends.

If you change the settings of your existing insight by filtering by an ad set or choosing an individual ad, then you automatically have a new insight and the you’ll see data for the new campaign. Your old data won’t show up any longer.

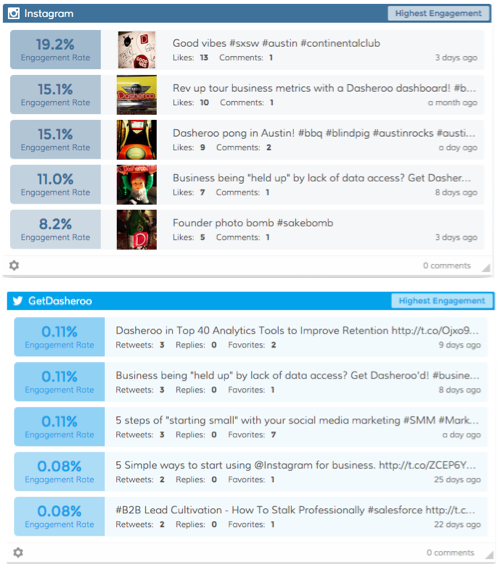
Instagram Engagement Insight Update

Dasheroo Instagram Engagement RateWe found an issue with how engagement is calculated for Instagram analytics, thanks to our user who reported it! The new Instagram engagement insight will replace the old insight. If you use the old one you’ll continue to see data. If you add this new insight you’ll see the new calculation.

We have basically changed the calculation from an interval strategy to continuous one. Now it will be a rolling total of likes and comments of your posts for the past 30 days.

If you delete the old and add this the new one, the data will grow from the time you add the insight. You won’t have access to older data so get in there and replace it now!

Ok, that’s it for now, we’re movin’ on to more!

What’s a Good Instagram Engagement Rate?

March 4, 2015 by John Hingley·0 Comments

Instagram can be a great way to get in front of now well over 300 million people (updated to 400 active monthly users as of September, 2015), it surpassed Twitter last year. So it was important for Dasheroo to provide free Instagram analytics for your dashboards! So what is engagement when it comes to Instagram? Simple: it’s the number of Likes and Comments divided by the number of followers you have. Why is your Instagram engagement rate important? It’s a great tool to compare other social networks to find what really works for your business.

Last year Social Bakers did a fantastic study. They measured the top 25 ‘most engaging brand profiles’ engagement on social networks. The winner? Instagram by a LOT!

Dasheroo chart of Twitter vs. Instagram engagement rate. Instagram kills it.

Instagram engagement rates kills it vs. Twitter for Dasheroo.

On a per post basis Instagram posts generated a 3.31% per follower engagement rate! That’s huge when you compare it to the average Twitter engagement rate of .07%. It’s almost 50 times more engagement per follower than other social networks.

Forrester also had a great study that found close to the same, they studied 3 million user interactions with more than 2,500 brand posts and discovered that Instagram posts generated a per-follower engagement rate of 4.21%, or 58 times more engagement per follower than other social networks.

But what does this tell you? We wanted to see how it was working for us and although our Instagram following is small we wanted to see it compared to Twitter. Although it might not be statistically valid, it’s directional and we’ll probably put more oomph into Instagram.

One big note here, Twitter is in the top 10 traffic driver to the Dasheroo site while Instagram is far from that so if you’re down with it being great branding and less transactional (posting a link is a pain) then make sure you add it to your social media marketing!

P.S. Don’t forget to check out your Ultimate Instagram analytics dashboard at Dasheroo, you can track all of your social media analytics too!


©2024 Dasheroo