Track Our Startup: New Release On the Way

As we told you last week we’ve been busy on our next release for your dashboards due out later this week. What’s new? A bunch!!

New Features for Tracking KPIs On The Way!

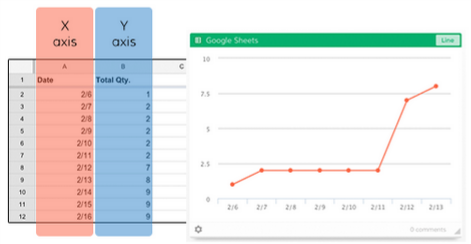
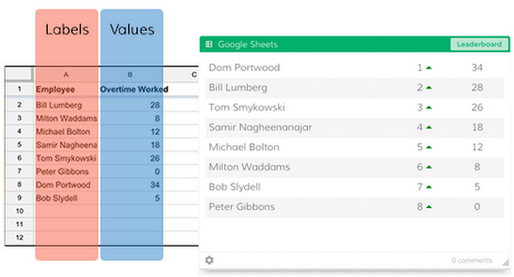
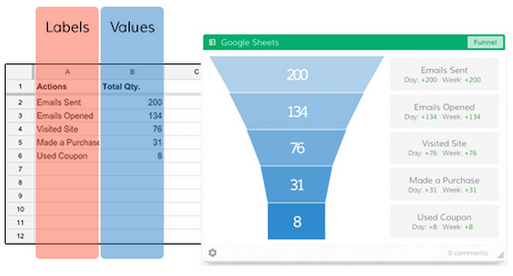
The biggest request we get from those who track KPIs on a Google Sheets dashboard is support for tracking multiple KPIs on one sheet. Well in the next release you’ll be able to support FIVE!!

You’ll also get access to these new features right from within your dashboards so every time we do a release it will be even easier to find out all the goodies you’ll have access to.

We’ll also have a few Quickbooks Online insights to add to your dashboards. Now you’ll be able to track KPIs like your P&L right from Dasheroo.

We’re also working to get our Active Campaign dashboard out so you can track all of your marketing KPIs in one spot. That will likely make the release after this one. Great job guys!

We’ve been doing pretty good with our SEO lately. We use a tool called SEM RushSEM Rush - Dasheroo SEO 
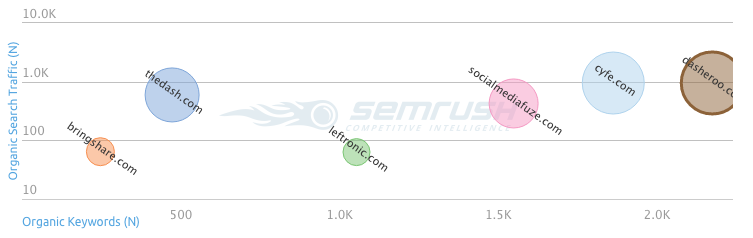
which we really like. It gives us great competitive intel for keywords that other businesses in our space are ranking for. We can easily see where we are plotted next to other businesses. In the chart on the right you can see that we are ranking for the most organic keywords that drive the right targeted traffic. Can you tell we love our graphs and charts here at Dasheroo? ?

Alf, our VP of Customer Success, has been busy recovering from the awesome onslaught of user questions and suggestions (which we love) from the Social Media Examiner article last week. It was an awesome article, How to Monitor Multiple Social Media Metrics in a Single Dashboard, thanks again @SMExaminer! We also had a record number of purchases we’ve ever had in a week.

Back to work!

Rebar Business Builders: Getting The Most From Your Data Dashboard

It’s awesome when anyone finds value in what Dasheroo provides, an easy way to track your business analytics on your data Rebar Business Builders logodashboard; plain and simple. And when someone goes as far as to write up an awesome blog post about that value we’re even more floored.

Bill Brelsford, CEO of Rebar Business Builders strikes again and he’s all about how to analyze data for your business to grow. His first post Building Your Business Dashboard was spot on! This new one entitled Getting The Most Out Of Your Dashboard nails it!

He talks about our Google Sheets dashboard – it is pretty powerful because you track things in spreadsheets all day and we make it simple for you to view charts, graphs and funnels!

One of his quotes is my fave: “When setting up and using your dashboard, make sure you are looking out the windshield more than the rear view mirror.” Or, sure look at what happened in the past, but figure out what should happen in the future!

Read it and if you need help with your KPIs talk to Bill!

How to Make a Beautiful Google Sheets Dashboard

At Dasheroo we use Google Sheets for, well, just about everything. They’re cool, they’re shareable and they won’t bring your non-Microsoft centric system down. Nuff said. So because we really needed them for our own use we figured “hey, wouldn’t the rest of the businesses in the world need a cool Google Sheets dashboard?” A resounding “YES” was heard.

The Line Graph Insight

The line graph is a great insight that will quickly point out anomalies; you can compare them with other line graphs, and have great insight into what’s happening over a given time period.

The Line graph insight allows you to select two columns or two rows within your Google Sheet to display in a line chart. You’ll select one row/column to be the X (horizontal) axis and then the other row/column for the Y (vertical) axis.

Line graphs on a Dasheroo dashboard from Google Sheet data


The Leaderboard Insight

A leaderboard lets you track who or what is in the lead! It’s great for tracking your salespeople, what products are sold the most or for us here at Dasheroo what business dashboard features are being requested the most!

​The Leaderboard insight allows you to select two columns or rows within your Google Sheet to display in a dynamic leaderboard chart. One row/column will be Labels (e.g. names of your customer support reps) and the other will be the Values that correspond to the Labels (e.g. # of cases closed per rep).
Regardless of the ordering of your Sheet data in the columns/rows you selected, the Leaderboard insight will automatically sort the insight in descending order with the “leader” listed at the top. You’ll also be able to see trending information so you will know if something has jumped or dropped a few spots since you last checked your insight.

Create a leaderboard Dasheroo dashboard from your Google Sheet data.

The Funnel Insight

We live and die by the funnel graph, read our post on How to Track a Conversion Funnel. They’re great for tracking conversion rates at every touchpoint. So you can see how many people started to do something and how many people completed what they were doing. For instance if you sent an email campaign you can see how many were sent, how many people opened, how many then clicked and how many ended up signing up or buying. Nifty eh?

The Funnel insight allows you to select two columns or rows within your Google Sheet to display in a funnel chart. One row/column will be set as Labels (e.g. the steps in a workflow) and the other will be the Values that correspond to the Labels (e.g. # of people who completed each step).

Create a funnel Dasheroo dashboard from your Google Sheet data.

There you have it, go on in and play around with making awesome Google Sheets dashboards for your business.