Startup Lessons Learned – Our First Quarterly Sales Plan

Acronym cartoonMy background and most of my experience is in online and direct response marketing, and that’s how we drive tons of usage and what we call ‘auto convert’ sales. That’s where we focus on smaller dollar amount sales via in-app conversion without a salesperson’s involvement. So although I’ve managed sales folks and developed sales plans at previous gigs, it’s not in my wheelhouse, as they say. So fortunately, I have sharp sales people I trust, board members with mucho experience in mid-market and larger company sales, and lots of sales friends to tap into to develop Dasheroo’s first quarterly sales plan.

When you’re talking sales planning, you have to get familiar with terms like ACV, MRR, ARR and CAC:

  • ACV = Annual Contract Value
  • MRR = Monthly Recurring Revenue
  • ARR = Annual Recurring Revenue
  • CAC = Cost of Customer Acquisition

I’m not gonna get in deep on the actual calculations in this post; there are plenty of excellent articles that do that just fine, I personally like a couple from the ‘For Entrepreneurs’ site: SaaS Metrics 2.0 – Detailed Definitions and SaaS Metrics 2.0 – A Guide to Measuring and Improving what Matters.

The gist of this post is the process of establishing what those values should be for our early stage startup. It’s all about setting aggressive, yet achievable goals that are aligned with building Dasheroo to become a very successful company.

So where to start?! We need to drive revenue, but we also need to realize at this early stage that we also have a lot to learn, including:

  • What are the key blockers to closing deals?
  • How long is the sales cycle?
  • What type of financial commitment will customers make?
  • Can we grow revenue per customer over time?
  • Can we get customers to commit to an annual agreement, even if they want to pay monthly?
  • Will they stick around? Churn kills!

All of this helps us establish the metrics that build a robust and accurate sales model, focusing on the Big 4 I mentioned above (ACV, MRR, ARR and CAC). Don’t get me wrong, it takes several quarters, I’d say at easily four quarters to get some valid numbers and account for seasonality to get to a point where there’s a good level of confidence in the model. But you have to start measuring Day 1.

I was, and still am, a proponent at this stage in driving a number of qualified deals rather than focus purely on revenue. That might sound crazy, but once again at this very early stage (we only launched billing in May) I think it’s important to get salespeople focused first on closing good deals, learning what keeps those customers around, or the features we need to close them, and using that information to ratchet up subsequent quarters, and factoring in MRR increases and ACV targets.

The second quarter I start to factor in some increase in MRR so they are also focused on developing a strong customer base as opposed to 1-offs that churn quickly or that we cannot grow into larger accounts. So here it is:

We're new and our salespeople are new, too! Here's our initial sales plan for our newbies

We’re new and our salespeople are new, too! Here’s our initial sales plan for our newbies

Yes, we have revenue numbers ascribed to this model as well, but I haven’t even shared those with my board yet, so it’s too early to publish it here!

I’m sure our plan will evolve and strengthen as we go, but it’s a start. How do you approach sales plans early on? It;s always a bit of gut instinct but I’d love to hear your experiences, either bad or great!

Startup Lessons Learned: Your Weekly Ops Meeting

Doug Savage business cartoon
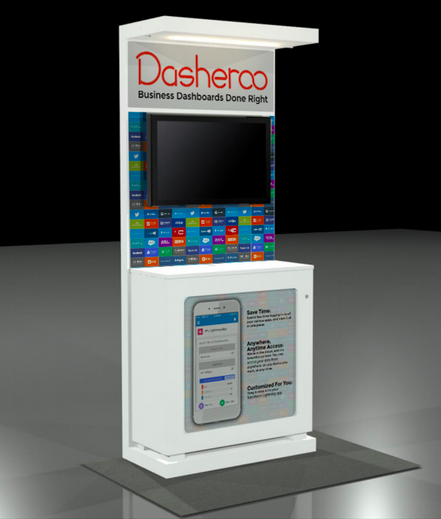
I’m fortunate, Dasheroo has an awesome team. From the 5 co-founders to the balance of our 12-person squad. For one, we have great chemistry and for the most part have all worked with each other at some point in our careers, so there is a ton of familiarity and respect among us all. Great communication is also key. As a distributed team, we take are heavy users of tools like Slack, Basecamp & Zoom. We have daily stand-ups where we hold a scrum-style ‘activities & blockers’ meeting, 1:1s and each Monday the 5 of us co-founders hold a weekly operations meeting. For this week’s startup lessons I’m focusing on the weekly Ops meeting.

Before we launched, a lot of our Ops meeting focus was around product and development deliverables.

But during a recent 1:1 with Josh, he brought up just this fact: “We all know each other, trust each other, and like each other, but are we really digging into the KPIs and discussing what we need to do to move the business forward?” The answer was…No.

I think we let that ‘familiarity’ aspect of the chemistry between the 5 of us get the best of us. Our ops meetings slowly turned into a ‘how’d the weekend go?’ and took on more of something I hate: an unproductive ‘status meeting’ where we updated a few top line goals and then passed the baton to the next co-founder. Ugh!

Let me remind you – one of the main reasons Dasheroo exists is because, during a stint at another company, I turned one of those ‘status meetings’ into what I renamed the Triple S (Sell Some S*^t!). And what that meant was that everyone in the meeting reported on their main KPIs, how each person’s activities affected the others and overall, how we could work together to make sure what we were focused on really helped drive business success.

So, the new format? KPI driven (what tool do you think we’ll use to report on those?!) with an accountability and group brainstorming perspective.

So here are the key business analytics we now focus on, and they should be obvious:

  • Website sessions and key sources
  • # signups (SU)
  • SU conversion rate
  • % SU who connected an Insight (this is an indicator of activity and engagement)
  • Conversion rate to a paid plan – We’ll expand this into a cohort analysis
  • Churn (we need to define this)
  • Revenue

The result after the first few ‘revamped’ ops meetings? Tremendous. For instance, as Janine was talking about the growth of our SEO and how our keyword targeted landing pages are helping capture mid to long tail traffic, James our VP Engineering noted that we should build a developer-focused landing page. Great! And that’s just one small win.

If this format sounds obvious, maybe you’re ahead of the game. But I challenge everyone reading to take a fresh look at your periodic (our is weekly) ops-style meeting and see if you are digging into and discussing your key performance indicators, and how you as a team can maximize your success.

New Release: Your Shopify Dashboard Is Here!

Dasheroo Shopify Dashboard
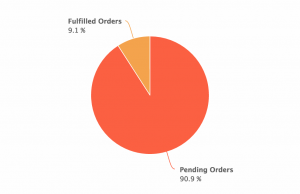
We’ve been working hard on rounding out our billing-payments-ecommerce dashboards for those of you who have been asking about tracking these metrics on your
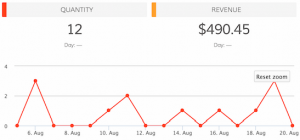
 Dasheroo business dashboards. Makes sense right? Who wouldn’t want to see their marketing dollars well spent on how much money is coming in the door.

So without further adieu, here is what you can now see in your awesome Shopify dashboard!

Sales over time

  • Trending insight of sales per day over the given time period represented as a line graph
  • Average & Median Sale value by cart

Orders over time

  • Trending insight of orders per day over the given time period represented as a line graph

Recent Activity

  • Most recent sales from your storefront with the appropriate status represented as a table

Most Sales

  • Transactions ranked in the order of $ sales, highest to lowest in the given time period represented as a table

Refunds Over Time

  • Trending insight of refunds per day over the given time period
  • Total refunds and total $ amount in refunds are represented as a line graph

Orders Received vs Fulfilled

  • This is an insight that will compare the number of orders to the number of orders fulfilled in the given time period represented as a pie chart
  • This tells you of all of your orders, how many remain to be fulfilled and the rate at which you are fulfilling orders

Orders vs Abandoned Checkout

  • This is an Insight that will compare the number of orders to the number of checkouts that were abandoned represented as a pie chart

Top Products

  • Leaderboard of the products that contributed most to the revenue in the given time period represented as a table

Customers Over Time

  • This is a trending insight of customers the storefront has acquired per day over the given time period represented as a line graph.
  • Total number of customers and total revenue

Sales by New and Repeat Customers

  • This insight compares the sales generated by new and returning customers in Shopify represented as a pie chart

Top Customers

  • Leaderboard of customers that generated most sales in the given time period represented as table

Top Sources

  • This is a leaderboard of traffic sources that contributed to maximum sales represented as a line graph
  • Traffic source include direct, referral , social, search engine represented as a table

Ok! If you use Shopify we’d love to hear your thoughts on what’s great, what’s not and what you need!

New Release: Google Analytics Ecommerce Dashboard

Many of you have been asking about tracking your ecommerce KPIs in your Dasheroo business dashboards. So we’ve been working hard to provide you with PayPal and Stripe which have been released and now we get to add to that with a Google Analytics Ecommerce dashboard.

Here’s what you’ll get:

Dasheroo's Google Analytics Ecommerce DashboardRevenue

  • Trending insight of revenue per day over time for the given time period.
  • Stats like total revenue, average revenue per order, conversion rate & number transactions

Top Products

  • Leaderboard insight listing the products that generated the most revenue by product name
  • A tabular insight

Conversion Rate

  • Trending insight of conversion rate for your storefront.This is the percent of visits in Google Analytics that resulted in an ecommerce transaction
  • Total conversion rate for the time period and the total number of transactions in the specified period of time

Recent Transactions

  • Tabular insight of the most recent transactions in your storefront during the given time period. This will include the transaction details like amount, customer details and date.

Revenue by Source

  • Breakdown of your revenue by source represented as a bar graph

Revenue by Medium

  • Breakdown of your revenue by medium represented as a bar graph

Revenue by product category

  • Leaderboard insight listing the product categories that generated the most revenue represented as a tabular insight

Revenue by Product SKU

  • Leaderboard insight listing the product categories that generated the most revenu represented as a tabular insight

Quantity

  • Trending insight of the number of units sold by your storefront in the given time period.
  • Total quantity sold and total revenue are metrics shown in the insight.

Best Selling Days

  • Leaderboard insight of days when your storefront made the most revenue represented as a tabular insight with date and $ amount of revenue.

Mashups

  • Transactions vs Sessions
  • Revenue vs Sessions
  • Revenue vs Transactions

So if you’re in the business of selling, you can have your own Google Analytics ecommerce dashboard!

Track Our Startup: Dreamforce ’15 Countdown is ON

We’re in release heaven here in Dasheroo. In just a month we’ve released PayPal, Stripe, an iOS app plus a TON of under-the-hood much needed stuff that you don’t see but it makes the expectation you have the things should just work, happen.

Dasheroo's Dreamforce booth 2015.15 Days to Dreamforce 15 (#DF15)

We selected our booth (ok “pod”) right next to MixPanel and VistaPrint at Salesforce.com’s annual event here in San Francisco! And you can bet we’re wearing our orange! We’ll be demoing something pretty nifty at DF15 so stop by if you’re there. You can get free expo hall passes here we’re told.

Upcoming Dashboards and Insights

We’re hoping to add to our ecommerce-billing-payments dashboards with a Shopify dashboard in the coming weeks. So those of you selling stuff and using this great tool for your shopping cart will be able to see your metrics.

We’re diving back into our Google Analytics Dashboards and coming up with insights for Google Analytics E-commerce Insights. We’re sticking with the question “how much am I making off of my marketing” dashboards. Following onto that will be Google Analytics Campaigns and Goals insights. Now you’ll be able to see right from Dasheroo if all of those efforts you’ve been working on are paying off in terms of sign ups or cold hard cash!

My new scintillating business.com article is out entitled Who Are You? Why Ignoring Your About Page is a Terrible Idea and Janine wrote her new Inc.com article, 3 Ways to Move Your SEO Needle.

Talk to you in a week for more of your business analytics updates!