At Dasheroo we try hard to make our user experience as seamless and as easy as it can be. We work very hard to give you what you’d expect to see when you take any action on the page. Today we’re going to talk about two awesome features that you absolutely need to know about.
Insight Details
As you know “insights” are what we refer to as the reports you have on your business dashboard. An insight is made up a graph, a chart, a list with some metric that you’re interested in tracking.
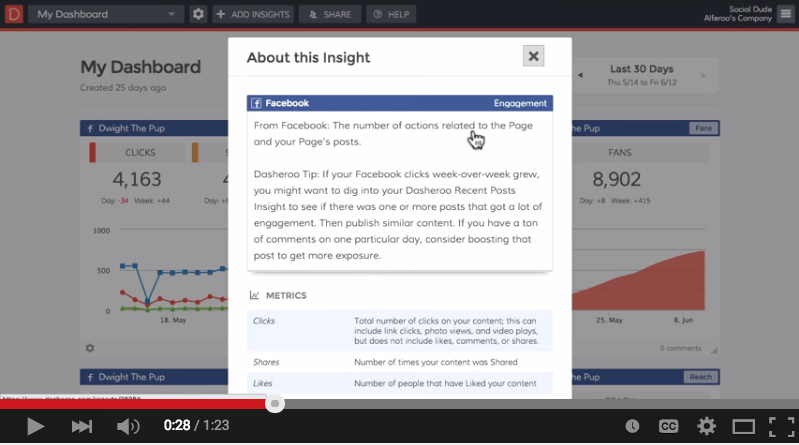
Click on the upper right hand part of the insight where y ou see the name of the insight and you’ll see the following:
- A description of what you’re looking at
- Recommendations for how to move the metrics one way or another
- If there are multiple metrics in a given insight you’ll see the description of each one
This is really essential especially if you’re sharing or collaborating with someone who might not know what they’re looking at.
Metric Details
Metrics make up your insights on your dashboards.
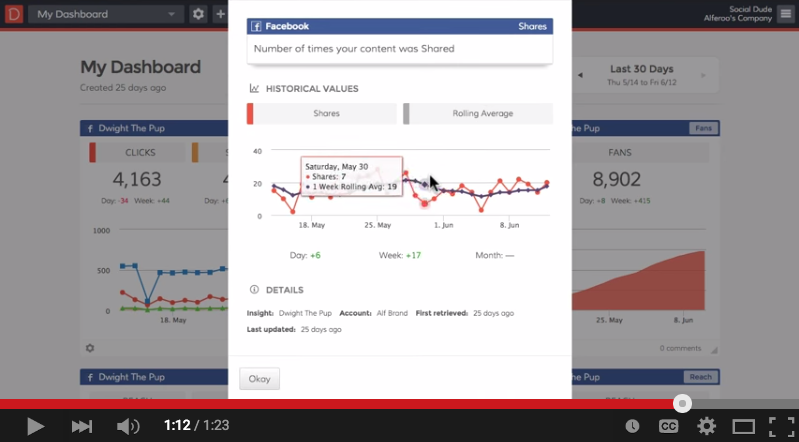
Click on any clickable metric or number inside of the insight and you’ll see some really great information like:
- A clear and concise description of the specific metric you clicked on
- The actual metric details over time
- A rolling average of how that metric is doing
There you have it, watch the short video explaining this and get on into your Dasheroo account and check it out!