Easy-to-create charts!
We’ve been talking about Google Sheets for a while now and we’re uber excited to tell you it’s out in the wild and can be added to your Dasheroo business dashboards! This was a pretty hard problem to solve since people use Sheets in so many different ways. We had to try to come up with the most popular ways and then make it easy to serve it up to you so that it makes the most sense.
What do you get?
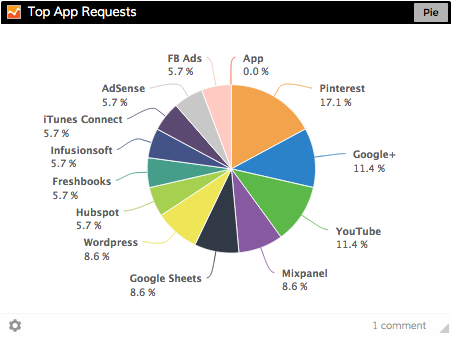
- Bar, Funnel, Pie & Line Graphs: It’s super easy to select your data from your Google Sheet and display it in a bar, funnel, pie and line graph.
- Tables: Bring in a table of up to 3 columns of any data that you select in your Google Sheet. It can be text or digits and you can view any changes that are occurring.
- Single Cell: Want to keep an eye on a spreadsheet cell containing a number you want to track? Maybe you’re wanting to track registrants to an event or your sales number, you can do that!
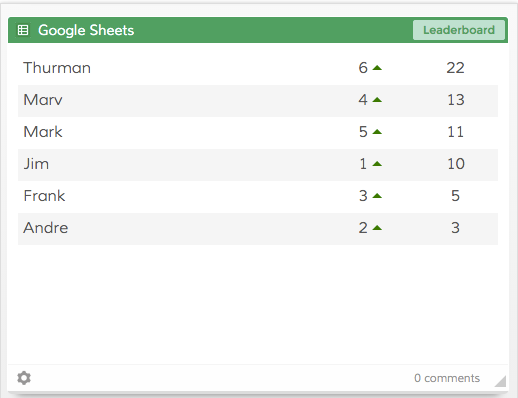
Track who is in the lead with our leaderboard Insight!
- Leaderboard: For your leaderboard Insight you can choose 2 columns or rows: one has labels and one has values. We automatically sort the values based on highest to lowest and rank them. We also give you a little trending up or down icon too!
Remember, all information is “read-only” so you’ll need to make changes to your data right in Google Sheets. However, we’re updating your data from Google Sheets every hour so if any change is made it will be reflected in your Dasheroo Google Sheets Insight.