- Twitter Followers vs. Facebook Fans – what a great way to compare audience growth!
- Facebook Likes vs. Twitter ReTweets – this can show you engagement comparison.
- Facebook Engagement Rate vs. LinkedIn Engagement Rate – instantly compare engagement rate across these two networks. Which one is performing better?
- Google AdWords Impressions vs. Google Analytics Sessions – wow, maybe your Adwords spend, in addition to driving tracked clicks, is also driving untracked users to your site. That might make your investment in Adwords seem pretty good.
- Twitter Re-Tweets vs. Google Analytics Social Sessions – See if you social efforts and engagement is driving users to your website.
- Facebook Reach vs. Google Analytics Sessions – another cool way to see if your social efforts are driving sessions or users to your website.
Here’s a sneak peek (shhhhh;)
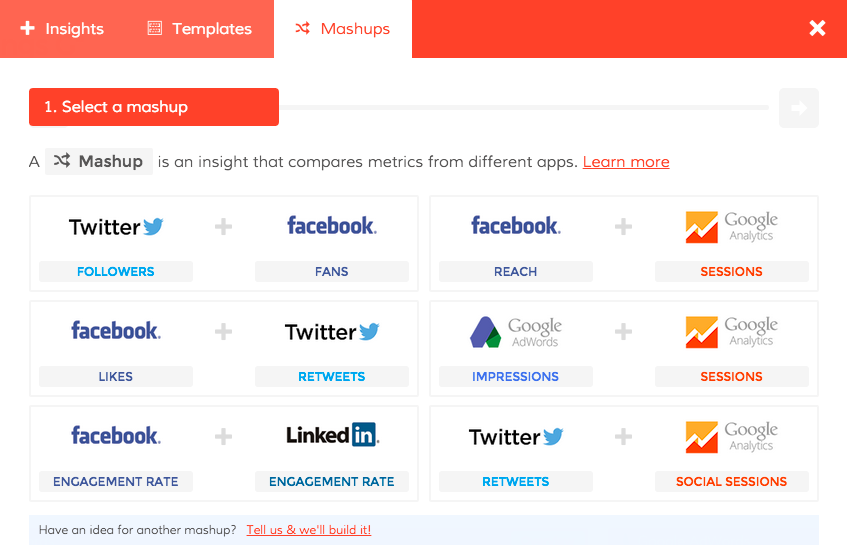
Our new business dashboard mashups! Coming soon to a screen near you
Now, we need to be careful about the ‘ol correlation vs. causation conundrum, since you may not be able to absolutely prove that one outcome affects the other. But it certainly does give you more insight into how your efforts in one area may complement or help out in another, or if your performance in one social channel is way better than it is in another. Sound good?
We hope so! Because when we officially launch Dasheroo (yup, ripping that ‘beta’ sticker off) on May 5, you’ll get a 1/2 dozen of what we call ‘mashups’, which will give you instant insight into just those metrics.
We hope ya like ’em, and as always you’ll get a chance to tell us about other multi-app Insights…we mean ‘mashups’!