At Dasheroo we’re all about looking at our Google Analytics dashboards when we get up in the morning, multiple times during the day and before we go to bed at night. Why? We’re a growing online business and we want a quick snapshot of what’s working and more importantly what isn’t.
So here’s what a portion of our GA Dashboard looks like:
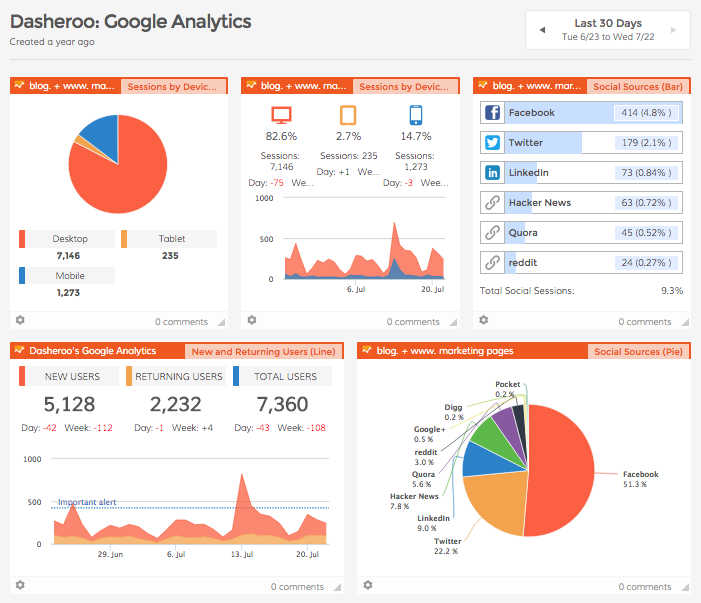
Here’s what we like to look at:
Since we do a ton of social media marketing (there’s a dashboard for that) we like to keep an eye on the Social Sources insight to track traffic to the website from our social channels. If you look at the pie chart above you’ll see that Facebook drives a ton of traffic for us which is great but every now and then we get a boost from Twitter, then we can go to ourTwitter Dashboard to see what’s driving the goodness.
We like to see our New and Returning Users insight. We always want to have newbies coming to our site more than returning users. The returning ones we love ALOT but they’re probably coming back to log in. A spike like the one you see just above is even better because that means a whole host of new users came to the site.
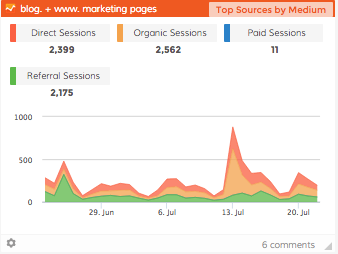
The Top Sources By Medium is a great way to track Google’s Channels to see how traffic is coming to your site. The Direct channel is people typing in your URL into the browser while the Organic channel is people searching on a keyword (not paid) and coming to your site. You can see here that there was a huge spike in Organic traffic on July 13. We like to closely monitor that especially since we don’t pay for it!
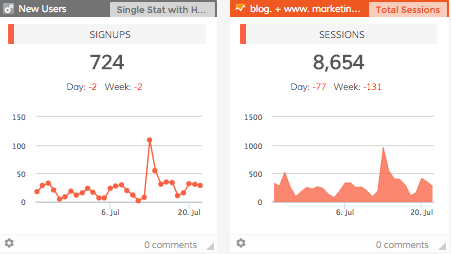
We also track our internal metrics in a Custom Insight [ SHORT VIDEO]. In this case it’s the total number of people who register for a free business dashboard. We like to put it smack dab in the middle of our Google Analytics Dashboard right next to our Sessions insight. Why? We like to make sure we’re getting around a 10% conversion rate and we are, phew.
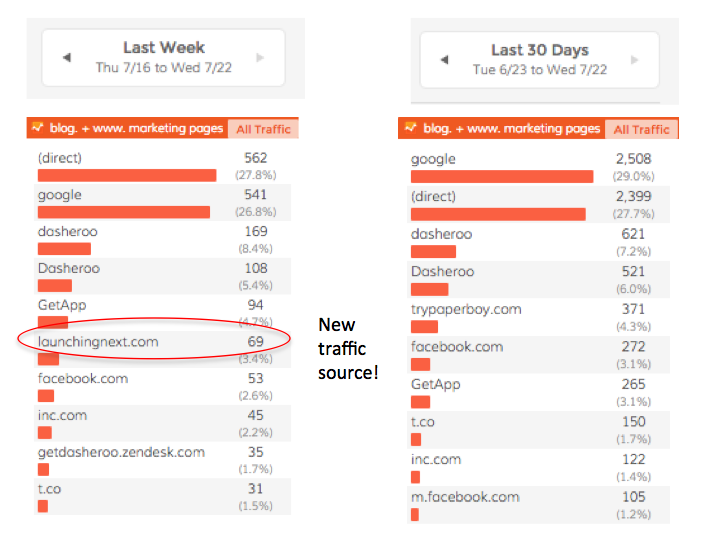
If we see that there might be something going on with traffic, like maybe we got a new traffic source (or lost an existing one) we compare date ranges on the All Traffic insight. We select a date range or “Last Week” vs. a “30-Day” range and compare where traffic is coming from. In this one you’ll see we got a new source of traffic because LaunchingNext linked to us and included us in an email. Awesome!
 So there’s a quick overview of how we use our own Google Analytics dashboards. When we need to dive deeper we go directly into our Google Analytics native account, but this gives us a great starting point to ask questions.
Oh, we’ll be adding even more insights to Dasheroo so check back frequently but don’t worry, we’ll tell ya!
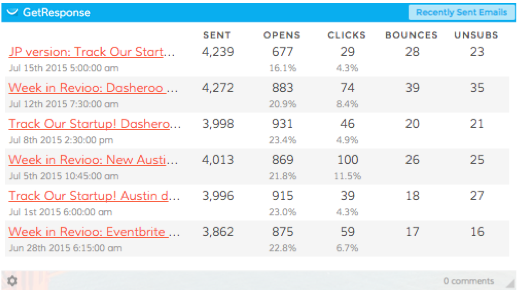
 Recently sent emails: A list of the most recently sent emails including the quantity sent, # opens, # clicks, # bounces and # unsubscribes, handy!