When we had our launch (read the story here) we also snuck in a few great new applications to add to your business dashboards; Emma for email marketing and Facebook Ads so you can track some of your ad stats. If you want to see the press release for our launch here it is.
We’re pretty excited about it and even more excited about our board meeting yesterday, the day after we launched Dasheroo, with our buddy Matt Holleran from Cloud Apps Capital Partners. We also had a bunch of meetings to talk about what’s going to be happening next (can’t we just relish the moment?) so after we chat this week we’ll sure be informing you about the roadmap, keep the suggestions coming though!
So for Facebook Ads, you’ll be able to filter your insights at the Ad, Ad Set, Campaign and Account level for:
- Overview – View all of the metrics below in one insight.
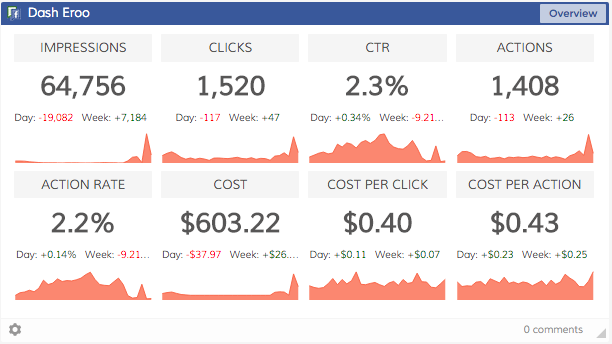
- Impressions – View your ad impressions over time. Impression = total number of times your ad entered the screen for the first time.
- Clicks – View the total number of clicks on your ad over time. Depending on what you’re promoting, this can include Page likes, event responses or app installs.
- CTR – View your click-through rates over time. CTR is all clicks ÷ by impressions in the date range.
- Actions – View the number of actions taken on your ad, Page, app or event after someone viewed your ad, even if they didn’t click on it. Actions include Page likes, app installs, conversions, event responses and more.
- Action Rate – View your action rate for your ads over time. Action rate is all actions ÷ by impressions in the date range.
- Cost – View your ad costs over time. Filter by Ad Account, Campaign, Ad Set or single Ad.
- Cost Per Click (CPC) – View your cost per click over time. CPC = amount spent ÷ number of clicks for the ad.
- Cost Per Action – View your cost per action over time. Cost Per Action = amount spent ÷ number of actions for the ad.
More excitement? We also give you insights for:
- Highest Click Through Rate – View a list of the last 7 ads that had the highest click through rate
- Highest Relevance Score – View a list of the last 7 ads that had the highest relevance score
- Highest Action Rate – View a list of the last 7 ads that had the highest action rate
Log into your Dasheroo account now and check them out!
There are a few things we do know that are coming:
Campaign Monitor! – If you use this cool email marketing app (and we love Alex, Craig, Sean and Andrea over at Campaign Monitor) you’ll be able to see a snapshot of your last few campaigns and how they did, how your subscriber growth is going and the trending of your overall click, open, bounce and unsubscribe rates. We hear that Aweber might be next!
Market New York (@MarketNewYork or #MKTNY) – We’ll be showing our wares in NYC, the big Javits center for a day, May 21st! This show is great, our buddy Ramon Ray is going to be there with Infusionsoft (also Smart Hustle Magazine, we love Ramon!) and Dave Kerpen from Likeable Local. We’ll be front and center with our selling shoes on (how can you sell something that is free?) in our fancy new booth. Visit John at the booth, he can’t wait to see ya!
Go check out Facebook Ads and Emma insights.