Lorena Elebee over at the LA Times did a pretty cool data visualization that shows over the past 3 months that El Niño might just be cooking up a bit (which we like!) Click to check out all three months.
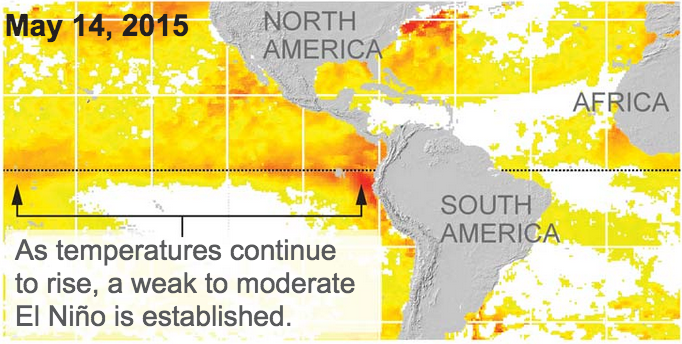
Lorena Elebee over at the LA Times did a pretty cool data visualization that shows over the past 3 months that El Niño might just be cooking up a bit (which we like!) Click to check out all three months.
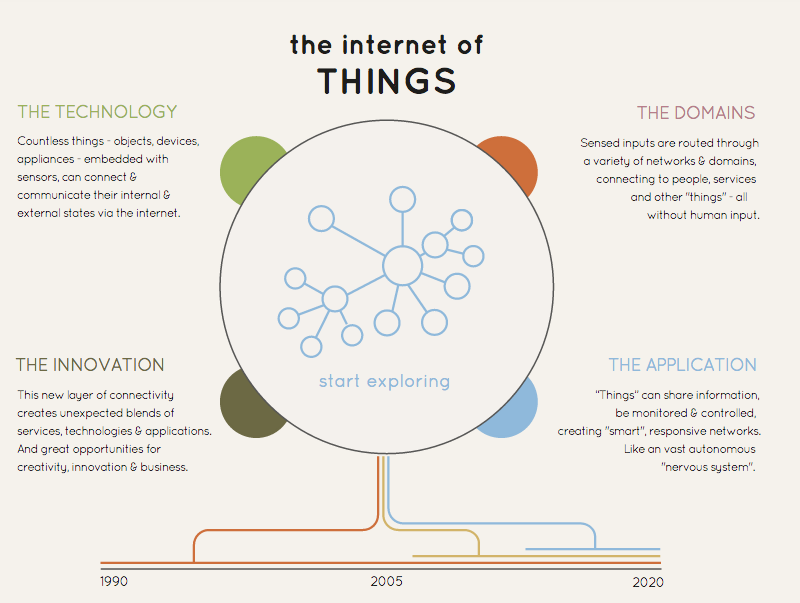
We love anything that Information is Beautiful puts out and this one takes the cake! They took the idea of the Internet of Things (IoT) and explained it in one lovely data visualization. Thanks guys!
It’s interactive so make sure you click around and see how buildings, cars, houses, people and everything relates to the Internet.
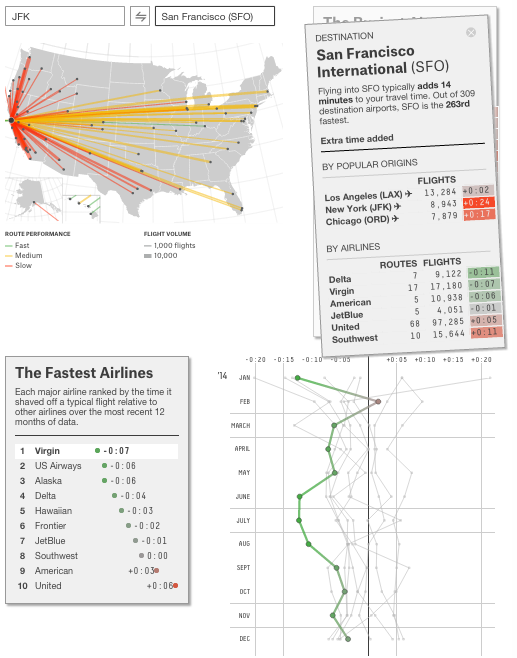
The amazing Nate Silver of the famous FiveThirtyEight dug into some big data deep to come up with some cool data visualization on fastest airlines by routes and best-performing airlines and airports. Go ahead, input your route and you’ll be amazed!
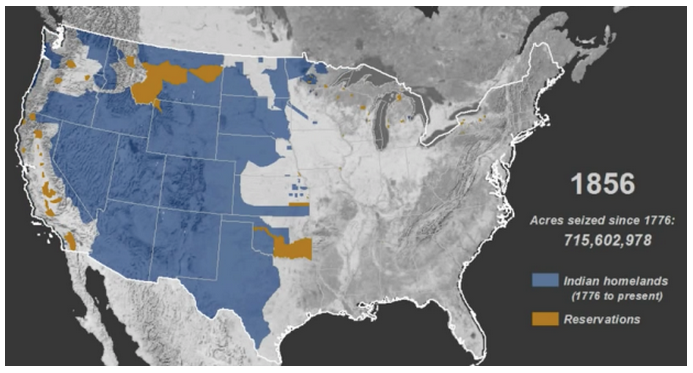
Thanks to the folks over at Flowingdata they pulled off another great one, mapping the invasion of America and the loss of Native American land. It’s pretty astonishing.
We always head over to Flowing Data to see what cool new data visualizations they’ve come up with or surfaced. This one is priceless. A Reddit user tracked his heart rate before and after his proposal while in Italy for 40 minutes. Wearing a heart rate belt you can see how he freaked out during the day and during the proposal, then calmed down and sat on a bench.
The awesome folks over at Flowing Data are at it again with the mapping relationship status by geography in the U.S. You’ll get a jaw-dropping picture of where more single, married, divorced, widowed and separated people are by county! Who knew?
We put our request for maps into the Dasheroo dashboard generator crew, we’ll see what we get!
Download this infographic.
We’re gearing up to shop small this Saturday, are you? Small Business Saturday helps SMB retailers to grow, and we’re 100% behind that! So this Saturday, the day after US Thanksgiving go on out and support local businesses and online small retailers.
Thanks to the fine folks over at Constant Contact we got this great infographic (since we’re into that geeky dataviz kind of stuff) and we were happy at the findings since it’s regarding how small businesses use data.
We like to see that:
 Obviously Dasheroo can help with that.
What a ride since just March it has been for team Dasheroo! We released our Alpha version of Dasheroo back in July, we got some amazing feedback from all of our great users and now we launched beta! Here’s what we’ve got so far:
Choose your Insights for your business dashboards!
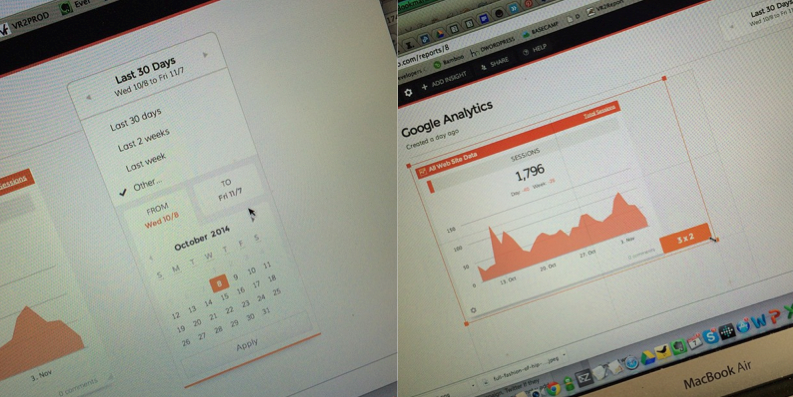
We’ve got custom date ranges and resizable Insights for your dashboards.
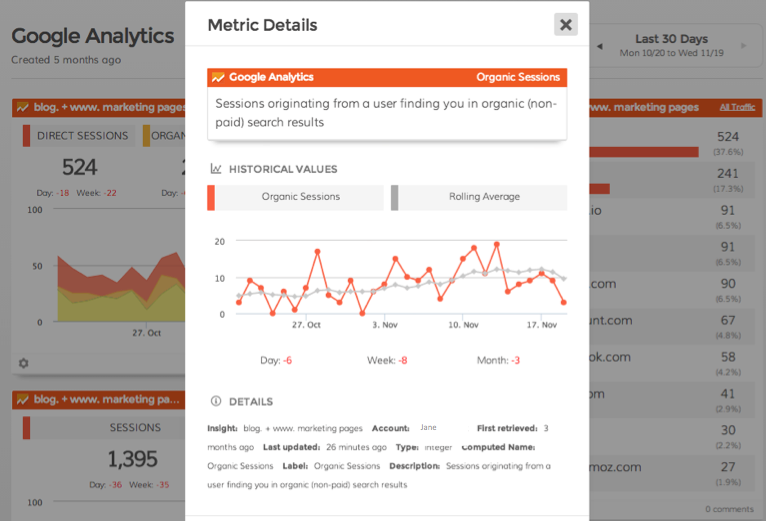
More info on the metric in every Insight.
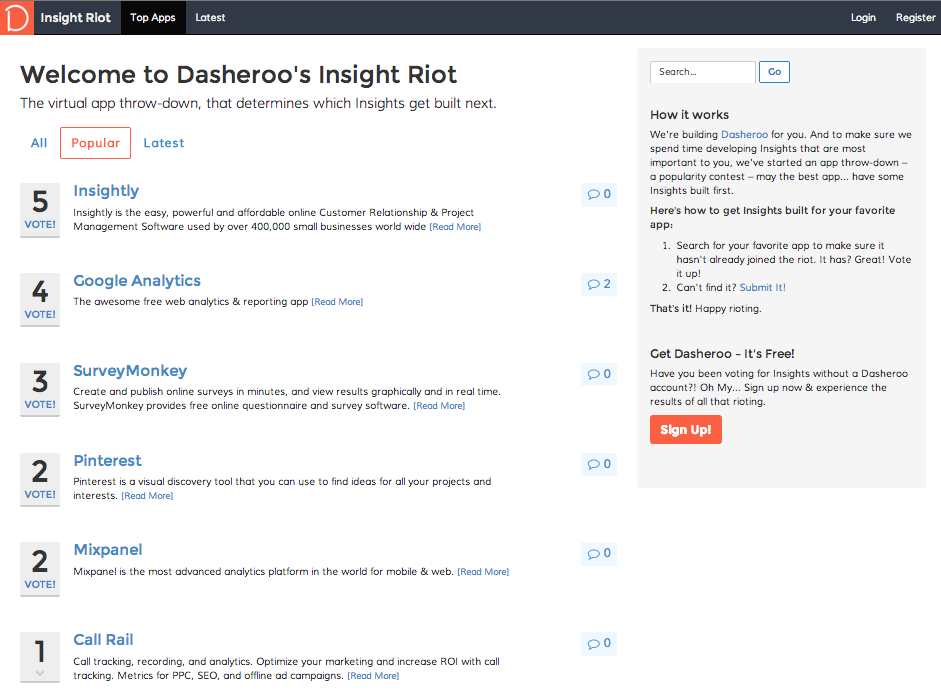
Vote for the next app you’d like to measure on your business dashboards.
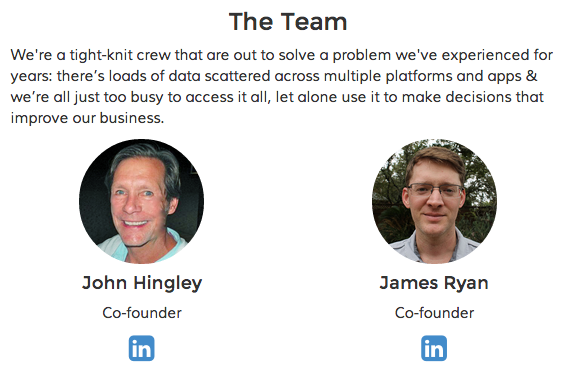
We love our leaders!
You can’t get enough of our funny charts & graphs!
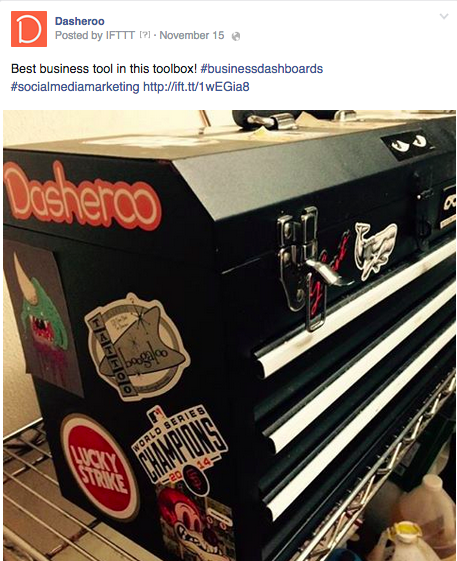
Love what they do with our coveted stickers.
Now it’s on! The real release with a s*it-ton more apps and features is coming your way. And if you’re a beta user you’ll get it and you’ll get it all free!
Nope, we’re not talking about Demi Lovato’s hit song! BTW she basically owns the first page of Google’s SERPS. Who would’ve thunk? Anyway, we’re talking about something much more fascinating. As in taking a cue straight from Jason Fried: ‘solve a problem YOU have’. And that’s why we’re starting Dasheroo. What’s the problem? Making sense out of the mountains of ‘big data’ out there, so you can focus on the Key Performance Indicators (KPIs) & metrics that really matter to your business. You want amazing business dashboards? You’re about to get them!
It’s a problem we’ve seen in about every company we’ve been involved with, and is usually (unsuccessfully) addressed by throwing bodies at it. At a recent tech company we consulted with, 9 people from the several departments took about 2 hours for each person just to update a Google doc with their KPIs for the weekly meeting. 18 people hours just to create a doc, not to mention make sense outta the info that will drive the business!
Painful. And expensive. And destructive to a business. So we’re out to solve it. Does it sound simple? Nope. Are others trying to solve this problem? For sure. But no one we’ve seen with the approach we have, which is coming soon.
So back to the title of this post. There are 5 of us kicking off our new company, Dasheroo. We’ve all worked together at some point in our careers, and none of us is under 35 (well, maybe one). We’ve all done the ‘start-up’ thing at least once. Actually if you add up the start-ups we’ve collectively been involved in, it’s well over a dozen. Most of us have families (we count both kids & dogs as family), like to eat good food and enjoy life. And work both smarter & harder. A semblance of balance. This is definitely not the Y-Combinator start-up formula, and you know what? That’s ok!
And I’ve gotta say, we have a dream team assembled to help make this real – front & back-end dev, product, marketing & business development, even branding & creative. Like I said, we’ve all been around the block and still feel that rush of ‘we’re really gonna do this!’
So here we go…again! We’ll keep you posted. In the meantime read our hopefully killer articles that will help your business grow, just like Dasheroo will.