New Release: Google Analytics Ecommerce Dashboard

Many of you have been asking about tracking your ecommerce metrics in your Dasheroo business dashboards. So we’ve been working hard to provide you with PayPal and Stripe which have been released and now we get to add to that with a Google Analytics Ecommerce dashboard.

Here’s what you’ll get:

Dasheroo's Google Analytics Ecommerce DashboardRevenue

  • Trending insight of revenue per day over time for the given time period.
  • Stats like total revenue, average revenue per order, conversion rate & number transactions

Top Products

  • Leaderboard insight listing the products that generated the most revenue by product name
  • A tabular insight

Conversion Rate

  • Trending insight of conversion rate for your storefront.This is the percent of visits in Google Analytics that resulted in an ecommerce transaction
  • Total conversion rate for the time period and the total number of transactions in the specified period of time
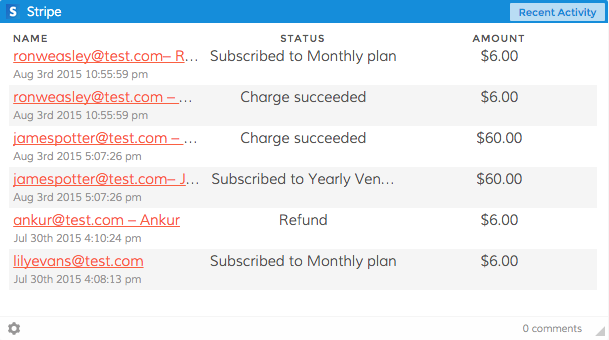
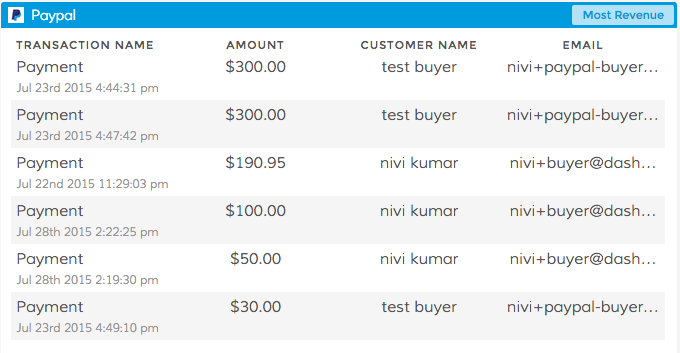
Recent Transactions

  • Tabular insight of the most recent transactions in your storefront during the given time period. This will include the transaction details like amount, customer details and date.

Revenue by Source

  • Breakdown of your revenue by source represented as a bar graph

Revenue by Medium

  • Breakdown of your revenue by medium represented as a bar graph

Revenue by product category

  • Leaderboard insight listing the product categories that generated the most revenue represented as a tabular insight

Revenue by Product SKU

  • Leaderboard insight listing the product categories that generated the most revenu represented as a tabular insight
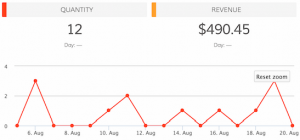
Quantity

  • Trending insight of the number of units sold by your storefront in the given time period.
  • Total quantity sold and total revenue are metrics shown in the insight.

Best Selling Days

  • Leaderboard insight of days when your storefront made the most revenue represented as a tabular insight with date and $ amount of revenue.

Mashups

  • Transactions vs Sessions
  • Revenue vs Sessions
  • Revenue vs Transactions

So if you’re in the business of selling, you can have your own Google Analytics ecommerce dashboard!

Track Our Startup: Dreamforce ’15 Countdown is ON

We’re in release heaven here in Dasheroo. In just a month we’ve released PayPal, Stripe, an iOS app plus a TON of under-the-hood much needed stuff that you don’t see but it makes the expectation you have the things should just work, happen.

Dasheroo's Dreamforce booth 2015.15 Days to Dreamforce 15 (#DF15)

We selected our booth (ok “pod”) right next to MixPanel and VistaPrint at Salesforce.com’s annual event here in San Francisco! And you can bet we’re wearing our orange! We’ll be demoing something pretty nifty at DF15 so stop by if you’re there. You can get free expo hall passes here we’re told.

Upcoming Dashboards and Insights

We’re hoping to add to our ecommerce-billing-payments dashboards with a Shopify dashboard in the coming weeks. So those of you selling stuff and using this great tool for your shopping cart will be able to see your metrics.

We’re diving back into our Google Analytics Dashboards and coming up with insights for Google Analytics E-commerce Insights. We’re sticking with the question “how much am I making off of my marketing” dashboards. Following onto that will be Google Analytics Campaigns and Goals insights. Now you’ll be able to see right from Dasheroo if all of those efforts you’ve been working on are paying off in terms of sign ups or cold hard cash!

My new scintillating business.com article is out entitled Who Are You? Why Ignoring Your About Page is a Terrible Idea and Janine wrote her new Inc.com article, 3 Ways to Move Your SEO Needle.

Talk to you in a week for more of your business analytics updates!

Track Our Startup: iOS Mobile App Released + Stripe + Dreamforce!

Dasheroo's mobile app for business dashboard

Go to the Apple Store and download your free Dasheroo iPhone app now!

Releases abound here at Dasheroo! The all-new Stripe dashboard feature released and we couldn’t be happier. Our Dasheroo iOS business dashboard mobile app is finally released as well. Now you can easily view your dashboards on your iPhone. Android to come soon. Get to the Apple Store and download it free! I told you about the 6 new projects we’re working on and we’re still working those. I can’t even keep up…

Sales are starting to roll in since we launched billing a short time ago, while Mimi closed a few larger deals.

We’ve been writing like crazy. My new business.com article is out: How The Power of Conversation Can Grow Your Business. It’s a great example of how actually talking to people makes great sales. Startup Lessons Learned: Be Fluid and Pivot! is out. I talk about the importance of being able to change on a dime in any business, especially startups. Janine writes another good one for Inc.com; When To Inject “Fun” Into Your Customer Experience.

WOneCon Constant Contact partner evente’ll be exhibiting at
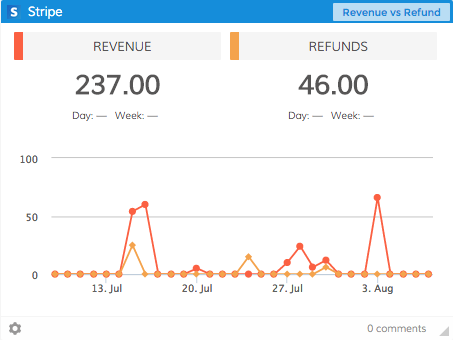
 Dreamforce in a few weeks, that’s Salesforce.com’s annual event. Josh and I are busy getting together our presentation since we’ll be demoing theatre style at the conference!

We’re going to Las Vegas for OneCon, a three day event in October where Constant Contact Solution Providers and Authorized Local Experts from all over the world are invited to network and learn from each other, Constant Contact executives, and small business experts. And since we’re an integrated partner where you can get your Constant Contact dashboard free right in your Dasheroo account.

In our never-ending attempt to gain placements in the SERPS we’ve got a new landing page for the keyword “small business dashboard”. We’re making pages for all of the keywords we want to be found for.

John at Dasheroo

New Release: Your Very Own Stripe Dashboard!

We are super excited for this release (partially because Stripe is our billing system) because many of our users have asked us for this and we feel we did a GREAT job at this all-new Stripe dashboard. Check out all of the amazing payment insights you now have access to!

Average Revenue Per User – ARPU is a valuable metric for subscription businesses to track revenue growth. It is the average revenue the business makes from one customer.

Monthly Recurring Revenue – Monthly Recurring Revenue is an important metric for every subscription business to track.It is considered to be a measure of predictable and recurring revenue for a subscription business. We calculate MRR as total recurring revenue in a month minus the refunds.Dasheroo Stripe Dashboard

Revenue vs. Refunds – This insight compares your revenue your business generated with the amount of refunds in the given time period. You will want to maintain a good balance between these two.

Stripe Fees – Stripe charges you a certain fee so that you can accept payments and use their services. This trending line graph shows you how much you spend in stripe fees in a given time period. This is a cost your business incurs and is a good metric to keep track of.

Refunds – Refunds issued by your Stripe account are represented as a trending line graph in this insight. This gives you an overview of how many refunds you have issued and whether it is trending up or down.

Recent Activity -The recent activity insight lists the most recent transaction in your Stripe account along with the Dasheroo Stripe dashboardstatus of the transaction and the $ amount involved. Activity can be a payment, a subscription, an upgrade, a downgrade, a refund etc

Refunds By Plan – Refunds issued by your stripe account are represented as a trending line graph in this insight. This gives you an overview of how many refunds you have issued in specific plans and whether it is trending up or down. You can choose up to 5 plans to view this insight.

Net Revenue – Net Revenue is the revenue your business generates after accounting for refunds, Stripe fees etc. This insight shows a trending line graph of your business’s net revenue in the given time period. The net revenue in this insight is calculated across all your stripe plans.

Net Revenue By Plan – Net Revenue is the revenue your business generates after accounting for refunds, Stripe fees etc. This insight shows a trending line graph of your business’s net revenue in the given time period for specific stipe plans. You can choose up to 5 plans to view this insight.

Customers – This insight shows you a trending line graph of the number of new customers who sign up for your business. In the given time period you can see how this number trends. This will include customers across all your Stripe plans.

Customers By Plan – This insight shows you a trending line graph of the number of new customers who sign up for specific plans your business offers. In the given time period you can see how this number trends. This will tell you what your popular plans are how many users sign up for them.

Upgrades – View the number of customers who have upgraded to a higher plan and how it is trending in the given time period.

Downgrades – This insight shows a trending line graph of the number of downgrades in the given time period. In a subscription business upgrades and downgrades happen. It is important to keep track of upgrades and downgrades as they affect your revenue numbers.

Failed Transactions – This insight provides a list of recent transactions that failed along with reasons why.

So get on in to your Dasheroo account and add a Stripe dashboard if that’s what you use for your payment solution!

Free PayPal Dashboards Just Released!

Dasheroo's Transaction By Type PayPal Dashboard

Dasheroo’s Transaction By Type PayPal Dashboard.

In an effort to get billing dashboards out to the masses we are super excited to announce that we’ve just released PayPal Dashboards! A large number of you have been requesting this for some time so we thought it was pretty important to get this out to you. Without further adieu here are the insights you’ll be able to add to your Dasheroo business dashboards to rock and roll your business.

Product Leaderboard – View the products you sell the most in a given time period

Transactions by Type -Transactions in PayPal can have many different statuses. This insight shows the different types of PayPal transactions in your account including completed, failed, refunded, pending , cancelled reversal etc.

PayPal Fees – Paypal charges you a certain fee so that you can accept payments and use their services. This trending line graph shows you how much you spend in PayPal fees in a given time period.

Refunds – Refunds issued by your PayPal merchant account are represented as a trending line graph in this insight. This gives you an overview of how many refunds you have issued and whether it is trending up or down.

Dasheroo's Most Revenue PayPal dashboard insight

Dasheroo’s Most Revenue PayPal dashboard insight.

Most Revenue – This insight shows a list of transactions in your PayPal account that contributed to the most revenue in the given time period. This helps you identify transactions that make the most money for your business.

Most Recent Transactions – The most recent transactions in your PayPal account are listed in a tabular format. Apart from the name of the transaction, details like the $ amount, fees charged by PayPal for the transaction, the net amount, status and the total balance remaining in your PayPal account at the end of that transaction are all listed.

Revenue – The most recent transactions in your PayPal account are listed in a tabular format. Apart from the name of the transaction, details like the $ amount, fees charged by PayPal for the transaction, the net amount, status and the total balance remaining in your PayPal account at the end of that transaction are all listed.

However you use PayPal you’ll be able to track your revenue and as always your feedback is hugely appreciated so tell us what we could be doing better!

Track Our Startup: Stripe Dashboards + Knee Deep in SEO

We’ve been super-crazy busy these past few weeks. Instead of releasing new features and bug fixes every two weeks we’ve been releasing EVERY WEEK! Our product and engineering groups have been so great at defining and developing the stuff you want, that we want to get it out live ASAP. Last week we told you were were working on iOS and Android apps, and they are still on the way. We submitted our iOS app to Apple last week, so now the ball’s in their court and we’re hoping for a speedy approval. Our Android app is in heavy QA and once we deem it to be ready, that’ll go into a submission process as well.

Dasheroo PayPal dashboardsWhat did we do?

We also told you we had PayPal dashboards ready to go, we’re just waiting on team PayPal to officially “bless” our integration. As soon as they waive their magic wand you’ll be able to see all of your incoming and outgoing payments on one nifty dashboard!

What are we working on?

Dasheroo Stripe billing dashboard

We’ve got a ton of insights for your Stripe dashboards on the way!

Stripe is on the way. On the heels of our PayPal integration we thought we should also give you your very own Stripe dashboard. Stripe is what we use here at Dasheroo for our payments. So you’ll be able to see metrics in a given time period like Revenue, Most Recent Transactions, Refunds and more in one easy to understand place.

We had been working on Alerts but had to pause development for a few weeks.

Alerts will allow you to set a specific value in one of your Dasheroo insight metrics and get sent an email if your performance goes above or below that set value, whichever one you decide. So if you’re looking closely at your Google Sessions and you think it might spike because of an article you just had published you can set a value for if sessions go over 10% of what you normally see in a day. Then you’ll know it’s working! The feature is still on the backlog and we’re about to pick it up again because we think it’s pretty cool.

We’re also getting closer to the beginnings of a competitive dashboard. You’ll be able to track your social media fans and followers alongside whoever you choose as a competitor. Me? I’d stick some RSS feeds on the dashboard as well to keep an eye on what my competitors our putting out their blog. More on that as we get further along.

Working on something special for September to show at Salesforce.com’s annual event Dreamforce. Unfortunately we’re under lock and key for this one but stay tuned, it’s pretty cool.

Marketing

We’ve been working diligently on our search engine optimization so we’re found on page 1 when people are searching specific terms. Here’s what we’re doing:

1. Landing Pages: We’re in the process of creating targeted landing pages that focus on specific keywords. For instance, when we refer to “Google Sheets dashboard” we link it from the blog to our Google Sheets landing page where we talk all about the benefits of Google Sheets. The link has the keywords in it as well (https://www.dasheroo.com/google-sheets-dashboard).

2. Inbound Links: We’re working off of a spreadsheet of sites that make sense to have us on them linking back to our site. The more quality inbound links your site gets the better your rankings in the search engines.

3. Contributed Content: If you’ve noticed, I’ve been writing for business.com while Janine has been writing for Inc.com. That list of publications we contribute to is going to grow in the coming months and you’ll see some great articles on sales, marketing and overall leadership. It’s a ton of fun and Dasheroo gets links from sites that have some great domain authority.

4. Linking Within our Domain: We’re linking between articles on the blog where it makes sense, we’re linking from the blog back to those landing pages and we’re linking between pages on the same domain. Google likes this and it makes sense to drive traffic to other parts of our site.

Back to work time!