Last week we told you about how we’re diving into hooking into Salesforce and LinkedIn. We got the authentication done but decided to focus on LinkedIn business dashboards to launch first.
If you haven’t seen it, here’s a great article on what’s available in LinkedIn Analytics. We still have to determine what metrics LinkedIn will provide us, but we plan to display a bunch of these stats right in Dasheroo in the coming weeks. They don’t provide much info on personal accounts (which lots of us use!) but they do provide deeper metrics for company accounts.
What, you didn’t know you could share and collaborate on a dashboard?
Because we got some amazing user feedback from our alpha users (keep it coming please!) we’re going to be looking at making the collaboration and sharing features more visible since they seem kinda hidden.
New Insight Descriptions will tell you exactly what it means, what data is being shown and examples of what you might do with it!
We’re also looking at ways to allow you to resize each Insight. This has been the #1 piece of feedback so far. It’s not an easy task, and thank you alpha users for that input, we’re noodling on that now.
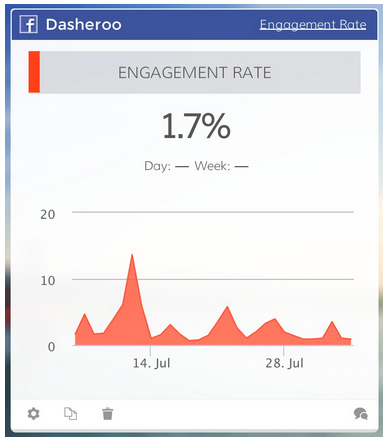
We’re also working on providing some deeper descriptions of each Insight you have. For instance the Facebook - Engagement Rate Insight.” What the hell is that?
So for each Insight we’ll provide “What am I looking at?” and “Why do I need this?” answers with some examples of how it might help.
We also had a great meeting with some very smart people that have been helping us with our product strategy as well as our pricing strategy. Even though we’ll be offering a version of our dashboards for free there will be some really cool upgrades that will be nominally priced. But we’re in the infancy stage of talking about this.
And finally we’ve been trying to get more of you to help guide us with how you think we can improve our dashboards. With your help they’ll continue to be even more kickass.