
Dasheroo’s Twitter Lead Generation Card
The other day we chatted about how to create a Twitter Lead Generation Card for your biz. Hopefully that was helpful, we recently created one and ran a small test. Remember, with Lead Gen Cards if someone clicks on the card (our CTA was “Sign up now”) when someone clicks on the card, they are automatically telling Twitter it’s ok to give you their information.
So, speaking of testing…how’d it do? Read on, we’ll take you through Twitter analytics and how the test stacked up for us.
a) So first, make sure you’re logged in, and then go to ads.twitter.com.
b) From the ads interface, click on Campaigns.
c) There’s you’ll see a summary report for your campaign, with spend, impressions, engagements, engagement rate and cost per engagement. This was just a small test as you can see.
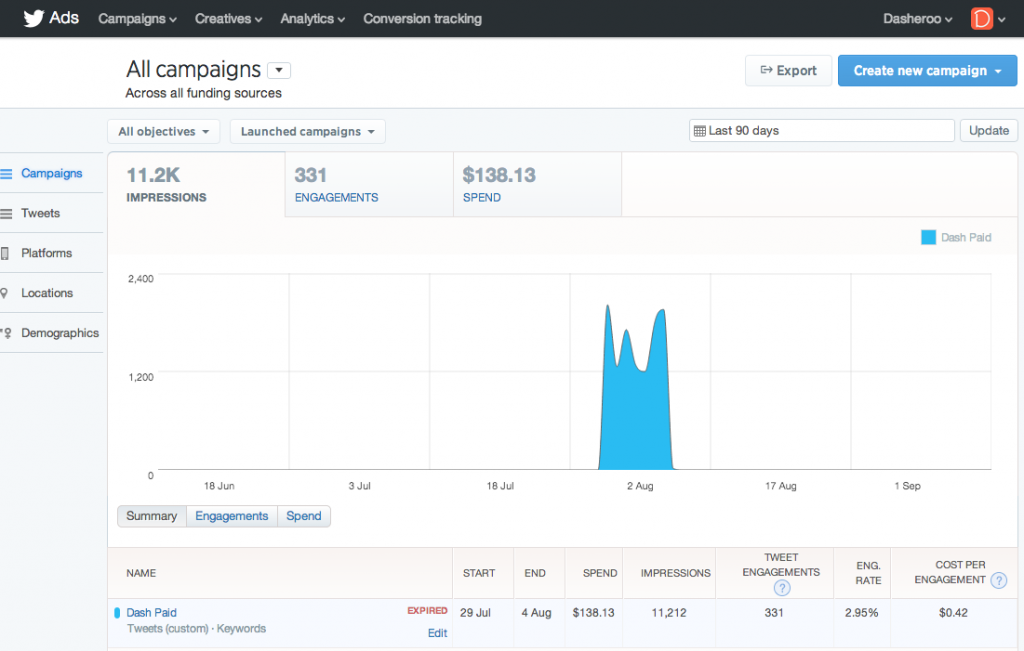
This report provides all the information we need, except LEADS
FYI, ‘engagements’ are defined as ‘All clicks on the ad (e.g. retweets, replies, favorites, follows)’. So these metrics are a start, but we since this is a lead generation card, we want to know how many leads we got!
d) So this is where Twitter makes it a little confusing…now, click on Creatives.
e) And it’ll list Leads, Spend and Cost Per Lead for our Campaign:
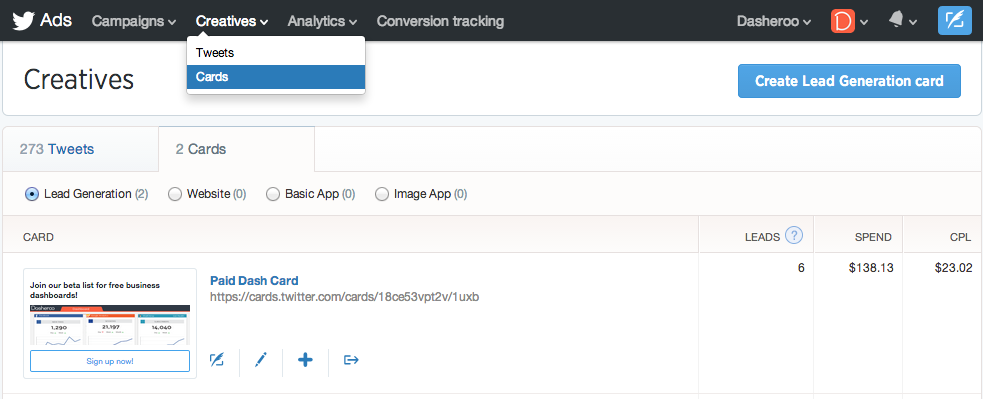
Now, we get our lead count
From our very small test, we generated 6 leads, at a cost of $23.02 per lead. A ‘lead’ in this case is someone signed up for our beta list. Is that good? Well, we’d prefer to spend $0, but this could act as a benchmark to compare with other forms of marketing.
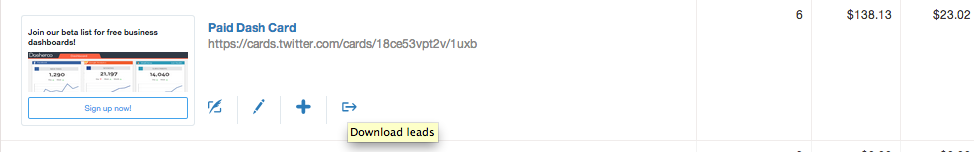
f) You can export your leads from here as well:
Note: This was by no means a statistical test, we just wanted to get familiar with Twitter Lead generation Cards, and will consider a larger test when we launch our product. We hope this helps!