 Whether you raise angel money, seed money or completely blow off taking any outside money for your startup, you need a cost model. A full-on ‘what cash is going out the door?’ model. In my opinion this is way more important at the inception of a startup, than some fancy accrual-based accounting model. Your cash burn rate, and cash management, is king. I may be slightly biased on that approach since I have a finance, not accounting, background but most folks I talk to agree.
You want to go into this process with your eyes wide open on both the cost and revenue side of your early stage business. As good as things may go, new customers and sales may start later or ramp slightly slower than anticipated, and costs are usually the opposite!
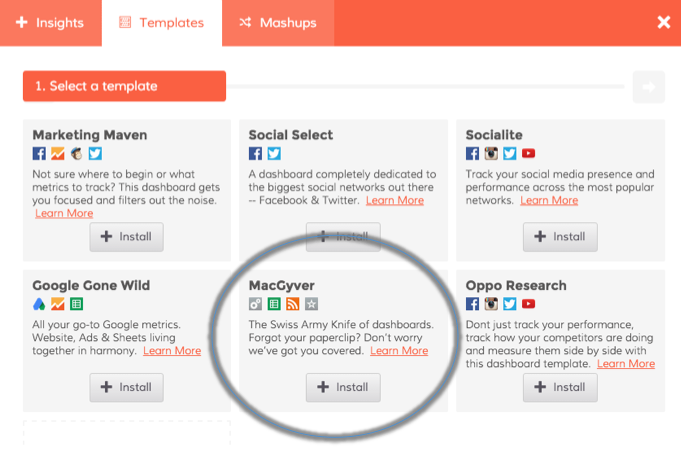
One of the first projects I took on after we decided that Dasheroo was ‘a go’ was just this, developing a cost model. I’m not calling it a revenue model because I knew although we would drive some sales early on, it’d be all about investing to establish and grow our team and product offering. Nobody’s going to pay for a 1/2-ass product, at least not for long.
It’s also really important to identify your big costs. There will always be some gotchas that you just didn’t anticipate, like that cool project management software that costs $50 a month. Oh well. As long as you don’t miss a ton of those you should be OK.
So where should you start? First, I think an initial 18-month cost model is a good place to start. Much beyond that is all B.S…I mean, conjecture. And, as detailed as you should be, you should focus on your big ticket items! At Dasheroo, we are leveraging our business freemium model to minimize marketing costs, so the real big expense is people. Our biggest expense categories are:
- Full time employees
- Contractors
- To lesser amounts:
- Legal & accounting (since we did raise an A round, legal fees were significant)
- Rent (as we are mainly distributed team, rent is for a small Austin presence)
- Marketing & Travel and Entertainment (T&E)
- Amazon Web Services, where we are hosted
- Software and back-end ops expenses (software like Zendesk, CRM, project management and Amazon Web Services)
Here was the first whack I took at this in late 2014, for January 2015 out. The actual amounts aren’t so relevant so this shows the distribution of costs across the main areas:
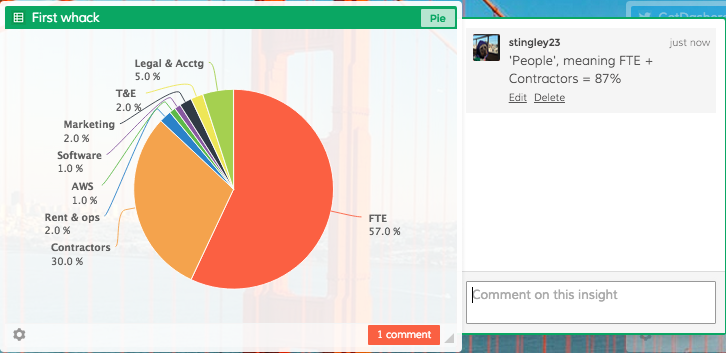
This was my initial cost estimate breakdown for our first 18 months.
As you can see, ‘people’ meaning both full time employees and contractors were estimated to make up 87% of our total expenses. That didn’t freak me out, I actually loved it! Great people build awesome things. And especially early on as you are defining and building your product, what else should you be spending on?
This estimate was made before we really had any money to spend, so it was just the best I could do at the time. Note - the total dollar amount also helped guide the amount we needed to raise in our A Round, which was $3.25MM. So, you can do the math!
The model is based on a monthly level of granularity. Other folks do these quarterly, but monthly works best for me. I like measuring on a more frequent basis, and so do my investors.
I then update the burn and input actual expenses each month, and report on variance to forecast to see if there are any big swings I need to take into consideration.
Like I said, things always change, especially when you do have money in the bank. So at least every three months I take a fresh look at what the next months look like. I just did this for the second time, after the initial 6 months of spend. Were there big differences from the original forecast? Let’s see:
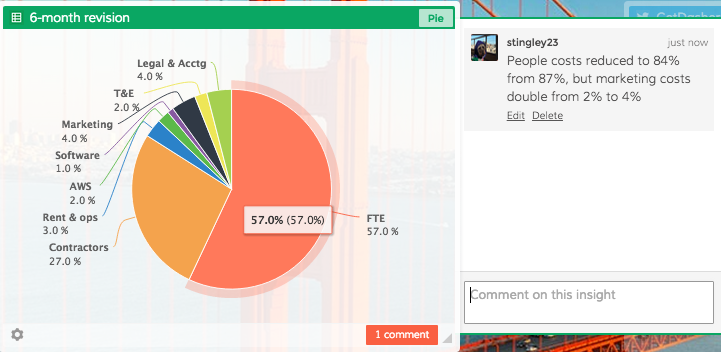
This was a subsequent revision after 6 months of real experience
Any big differences? Nothing shocking, at least from an ‘expense by category’ perspective. as Not huge, and our % held steady by category. People costs ticked down 3% as we dialed in our main out side contractor, and our marketing share doubled from 2% estimate to 4% of total budget. That’s due to us getting some more detail around key events and trade shows that we plan to exhibit at or attend. We still don’t plan on spending any money on Google Adwords.
Now, if you’ve read this far, you may be asking: “Sure, cost share by category held pretty steady, but how about overall expenses. Did they increase or decrease?”
Great question! Yes they did increase, by approximately 3.5% from original. Now, we are in control of most of this, since our Cost of Goods is very low and the majority of the spend is still in people. So if necessary we could delay a hire or two if we choose to do so.
But, you may have noticed this is pure expense burn before layering in any revenue, which we are already generating, so we’re in great shape.
The bottom line here is that you hope your expense projections do remain in line, but as you gain experience use that to revise projections and make sure you are not spending too far in advance of your model. And make sure to get input from, and share with your team members. Everyone needs to understand the state of the business, and how their actions and performance affects expense and revenue.

 se you


 I’m fortunate, Dasheroo has an awesome team. From the