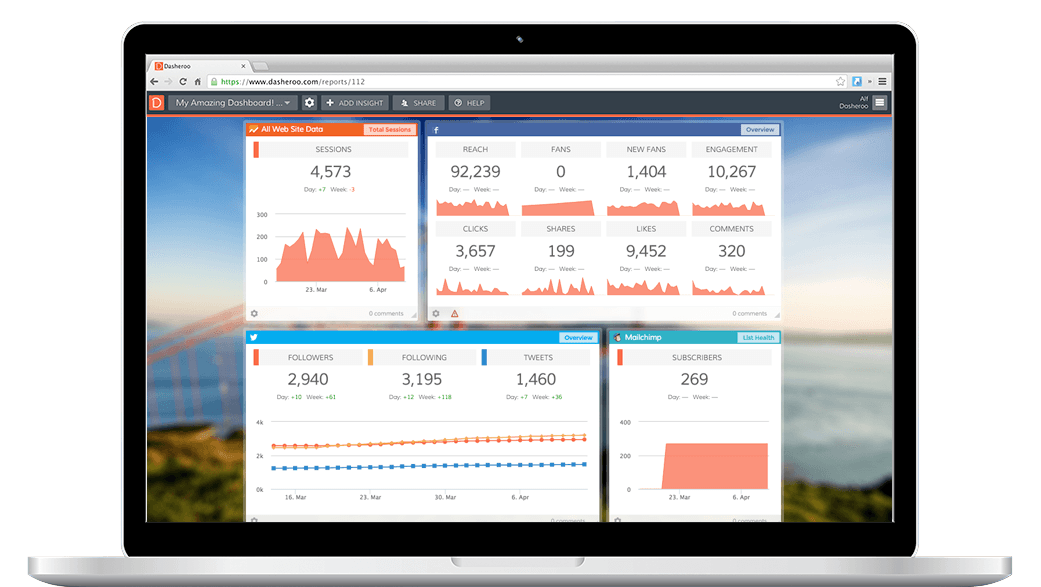
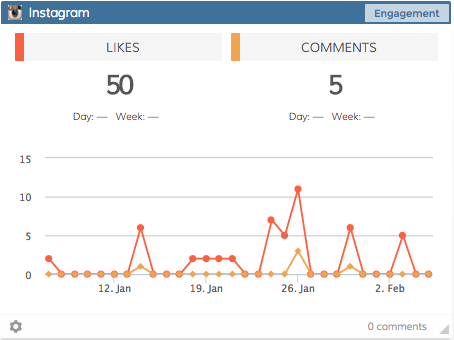
We’re excited to announce that we’ve just released the #1 MOST REQUESTED APP BY ALL OF OUR USERS; INSTAGRAM BUSINESS DASHBOARDS! Sorry for the brief scream it’s just so supercalifragilistcexpialidocious!
 What do you get?
- Overview - Total number of Followers, Following and Posts per day (line graph)
- # of Followers (line graph)
- # of Following (line graph)
- # of Posts (line graph)
- Engagement # of Likes and Comments (line graph)
- List of 5 highest engagement posts
- List of 5 most recent posts
Get your Free Dasheroo account (or login) to see it in action!
But wait there’s more…
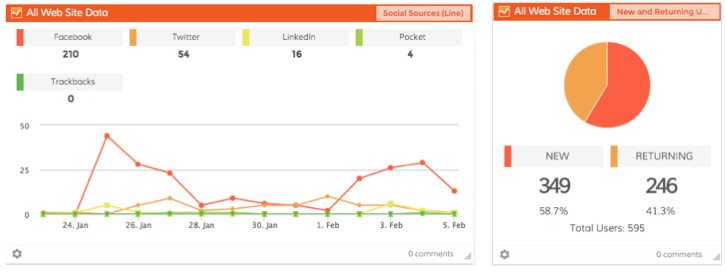
We were also able to get a few more Insights in there for your viewing pleasure. In your Google Analytics dashboards you can now get a line graph of Social Sources and a pie chart of New and Returning Users. We also intro’d a few new colors into our graphs that make it easier for you to see.
There you have it, cheers!