We’ve been talking for a few weeks now about how we’ve been tapping into LinkedIn to get you Dasheroo Insights into how you’re doing with the ever-growing social network. Guess what? It’s LIVE!
So what can you do? You can add the following LinkedIn Insights to your business dashboards:
LinkedIn Personal Information
This is a tough one because LinkedIn doesn’t expose much information to us to enable us to give you this info. So we got what we could tap into and provide you:
Connections:
- If you want a quick snapshot of how many Connections you have and you have under 500, you’ll get it over time. LinkedIn purposely caps the Connection count at 500, as they state they don’t want ‘total connections’ to turn into popularity type contest that could get gamed by people wanting to look more influential than they really are…hey, LinkedIn, how about upping that to 2,500 or so??
Engagement:
- You’ll see your engagement rate of any content you’re posting from your Personal profile over time, this way you can keep an eye on how your posts are doing.
-
Easily check out your Company followers on LinkedIn!
You’ll also see your last 5 posts and the engagement rate for each post, so you’ll know what types of content resonates with your Connections.
- You’ll also see the 5 highest engagement posts you’ve done.
LinkedIn Company Information
Followers:
- You’ll get the total number of people that follow your company over time. As you’re tracking this stat you’ll see if you something you posted got you a spike (or dip!) on followers.
Engagement:
- You’ll see the engagement rate of any content you’re posting from your company over time
- You’ll see the engagement over time so you can track how many Likes, Shares, Comments and Clicks.
-
Track your recent posts and what’s going on with them right in your Dasheroo dashboard!
You’ll see your last 5 posts and the engagement rate for each post. Like your personal profile, you’ll want to keep an eye on what your Followers are engaging with and do more of that. Remember, if your followers engage with your content their Connections are likely to see it!
- The 5 highest engagement updates so you can compare what you’re posting to your best posts ever!
Pretty cool eh? We’d love to get your feedback on it!
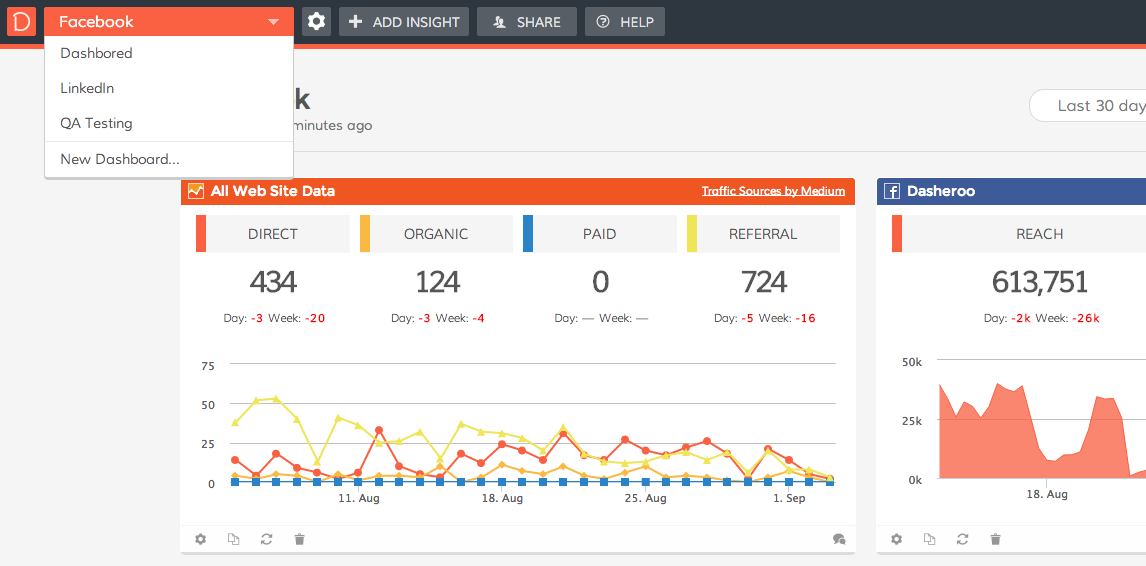
User Interface Changes Abound!
See ya later, Dashboard Tabs: Speaking of tabs, you used to have a tab for each dashboard, but what we found is that many of you over time had more than a few dashboard so the tabs went away and were replaced by a pull down menu. So now we just have a pull-down menu for all of your dashboards. This makes it consistent with our mobile experience, too.
Settings: We pulled Settings out into its own tab. Why? So that you know that you can have settings that correlate to each dashboard you have. You can now change the name, show comments, copy, delete, enter full screen mode or change the theme right from Settings.
Share: What we heard from you is that you couldn’t really find how to share your dashboards with your colleagues or clients, it just wasn’t that intuitive. So we pulled Share out into its own tab.
With Share you used to have a sharing feature where a dashboard had a public link. We found that many of you didn’t like that fact that Google could actually index your dashboards you wanted to keep private with people in your own company or your clients. Now you can do both. You can share a dashboard publicly or privately.
We think it’s a cleaner way to look at things and get to where you need to go, but we’d love your feedback on the new changes so please let us have it!
Related posts:
 Business Dashboards Gone Wild - Closing in on LinkedIn Data
 Track Our Startup - LinkedIn Dashboards, Here We Come!
 Track Our Startup! We Launched Twitter for Your Business Dashboards
 Track Our Startup - Diving Into LinkedIn & Salesforce Business Dashboards
 Track Our Startup’s Progress with Business Dashboards - Fun With Custom Dashboards