Last week we took our lead developer out to dim sum. Since we live smack dab in the middle of the land of dim sum we thought it was appropriate, plus we don’t get to hang out that often so it was extremely cool. And what better place to go than Hang Ah the oldest dim sum house in the U.S. right? We musta had about 10 dishes covered with spicy black bean sauce. Yum. We digress. We need a dashboard for the number of times we hit up this place.
Ok, last update, we told you all about our ongoing QA with our data feeds for your business dashboards, and with each passing week we get even closer to our Alpha release it’s time to batten down the hatches. We’ve been getting alot done on the backend of our product to support our scale.
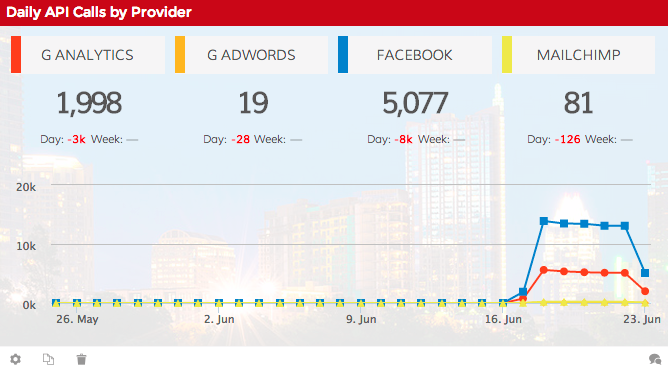
We started to measure the data we get back from your data providers using a Dasheroo Custom Insight.
One of the coolest things we did was used our own Custom Insights to develop some nifty internal reporting. For instance, we need to know how many times our servers talk to Google’s and Facebook’s to bring your data into your dashboard. Both have these nasty limitations that we need to be aware of and optimize for. Now we can easily see how close we’re getting to hitting those limits.
In other breaking news we’re at over 3400 Facebook Likes, and engagement continues to increase. We’ll even be launching with a Facebook Engagement Insight, that’s news. We’re over 460 Twitter followers. We’ve been actively posting to Linkedin and we’re pinning some fun charts to Pinterest. You need to check them out for a laugh.
We got our startup listed on Betalist and they KILLED it for us. Thanks guys. We got THE most traffic and the most leads then we ever could have hoped for. We highly recommend it.
Onward and upward this week, we’ve got a ton to do.