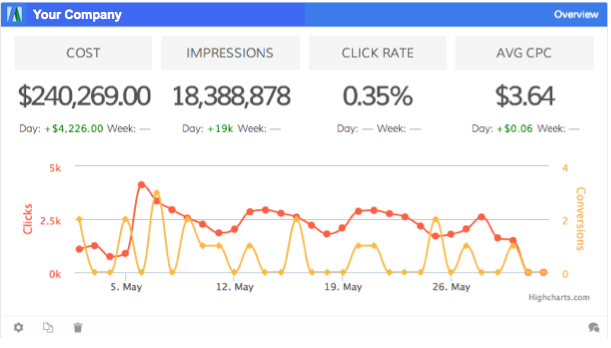
Our new charting gives you the ability to track different variables on multiple axes!
Last week we told you we got further along with our deep dive into Adwords Insights for our business dashboards. Well TA-DAAAA! We got ‘em! Now you’ll have access to a bevvy of Adwords info at your purdy little fingertips.
What else happened?
We changed charting software from Charts.js to HighCharts. Why is this cool? So you can have two variables on one graph. Fancy.
We attended Subscribed, we LOVE the guys at Zuora who put on this show. More on that tomorrow.
We also worked on the “What’s Your Gig” part of our website. It’s pretty cool, you can get a quick view of what your own dashboard might look like depending on what you do in your biz.
We’re posting funny charts all the time, our latest is based on that amazing rock singer Meat Loaf. We’re up to over 2500 likes on Facebook and over 400 Twitter followers so make sure you’re following us. We’ve also got hundreds of early access people who have signed up so make sure you’re on the list before we close it!