The New York Times reported on how Senator John Walsh plagiarized a large portion of his final paper towards his master’s degree. Oops.
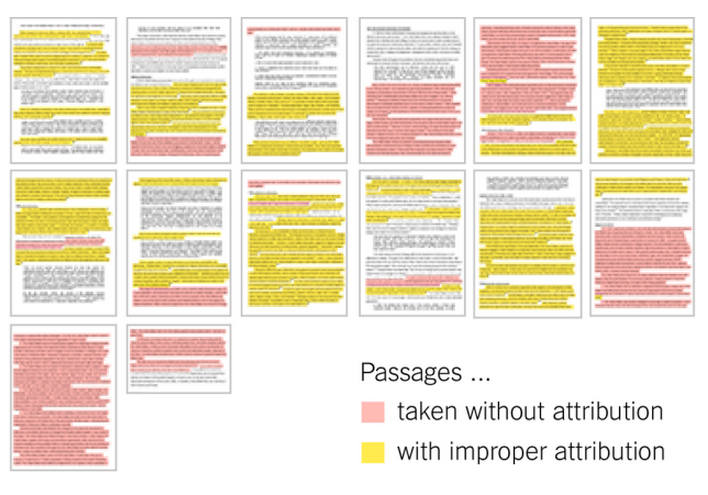
Thanks flowingdata.com!
The New York Times reported on how Senator John Walsh plagiarized a large portion of his final paper towards his master’s degree. Oops.
Thanks flowingdata.com!
Stay on top of the business analytics from all of your favorite applications. From Google Analytics and Adwords to Social Media and Ecommerce analytics, we’ve got ‘em. Dasheroo is the one stop business dashboard for all of your business analytics.