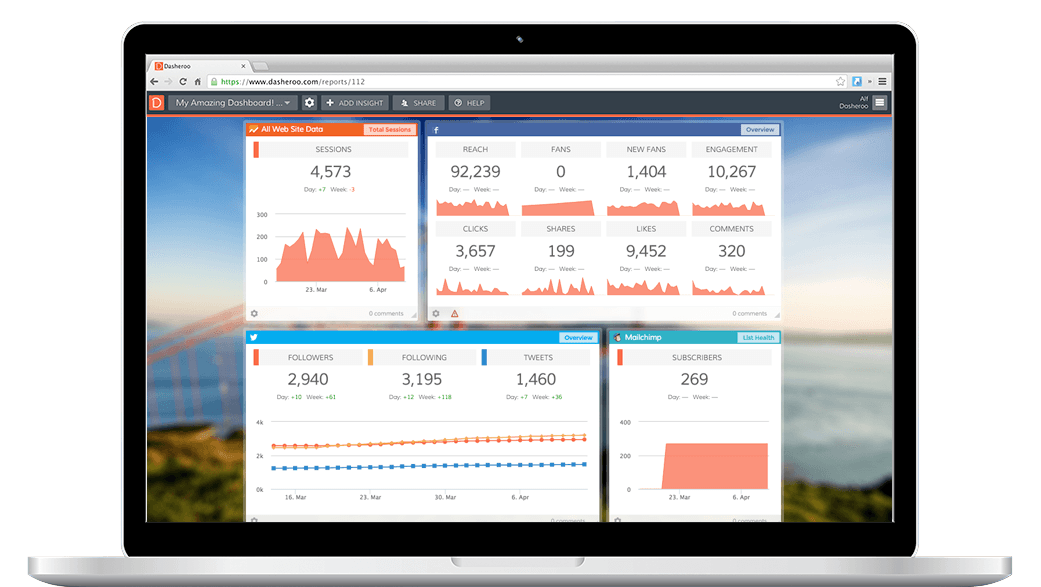
Last week we told you that we’re working on Salesforce dashboards, which is totally epic. We’ll get there in the coming weeks. Insights into Salesforce.com Leads and Opportunities will be the first few we’ll launch. Then we’ll dive deeper as you tell us what you’d like to see.
In the meantime our engineers were NOT sitting around thumb-twirling. They cranked out 4 VerticalResponse Insights so you can track your email marketing campaigns in Dasheroo.
So you’ll see: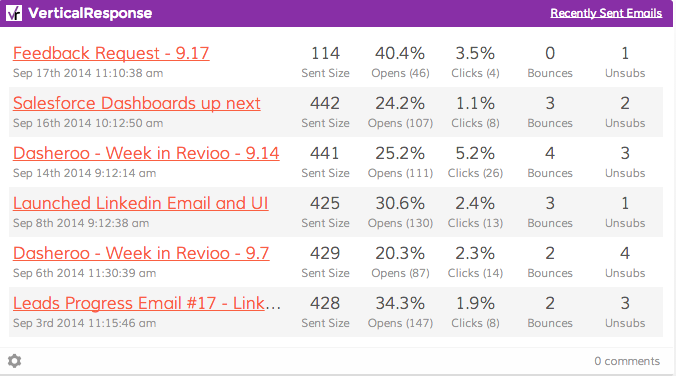
- Your last campaigns, how many were sent, how many opens, clicks, bounces and unsubscribes for each campaign. (You’ll be able to click through to each campaign.)
- Your click and open rates combined over time.
- Your bounce and unsubscribe rates over time.
- The total number of subscribers that sign up to your list.
Cool, huh? We should be launching these business dashboards next week so stay tuned.
We also heard that you want custom date ranges. We can do this on some of the more straightforward Insights but not on all, so we’ll be working on that.
Have you given us feedback yet? We thrive on the good, bad and the ugly so please feel very free to tell us what you think.
Tuesday, we were featured on Product Hunt! Holy moly did that drive a ton of new users. If you vote for us we might get some more exposure, please vote!
The team is working on getting a better first-time user experience. It’s important that our users can easily navigate their way to connecting to their apps so we’re trying to streamline that. Mixpanel has been a real help in telling us how many people are falling off and how many continue on.
More discussions have been happening on the funding front. We’ve been bootstrapping this since March so it would be nice to have a little dough in the bank to grow faster (even though we think we’re smoking through a ton of this work!) It’s important for us to find the right partner at this stage of the company and we think we have!
We’re marching towards our next milestone; a beta release. Alpha was the first one. Our beta is set for October 15.
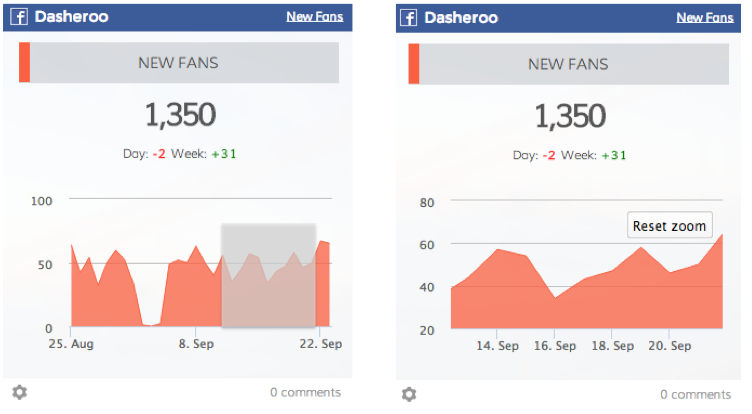
Click on the graph at the date you want to see and drag your mouse to the end date, then you’ll see that specified date range data!
Didyaknow?
You can click and drag over any part of a line graph and select a date range to zoom in?
As a separate option to selecting your own date range you can click on any part of a graph (graphs only!) and drag to where you want it to report on.
Then you can simply click “reset zoom” to see the original date range you specified.
Get in there and check it out!
More goodness next week!