New Release: Google Analytics Ecommerce Dashboard

Many of you have been asking about tracking your ecommerce metrics in your Dasheroo business dashboards. So we’ve been working hard to provide you with PayPal and Stripe which have been released and now we get to add to that with a Google Analytics Ecommerce dashboard.

Here’s what you’ll get:

Dasheroo's Google Analytics Ecommerce DashboardRevenue

  • Trending insight of revenue per day over time for the given time period.
  • Stats like total revenue, average revenue per order, conversion rate & number transactions

Top Products

  • Leaderboard insight listing the products that generated the most revenue by product name
  • A tabular insight

Conversion Rate

  • Trending insight of conversion rate for your storefront.This is the percent of visits in Google Analytics that resulted in an ecommerce transaction
  • Total conversion rate for the time period and the total number of transactions in the specified period of time

Recent Transactions

  • Tabular insight of the most recent transactions in your storefront during the given time period. This will include the transaction details like amount, customer details and date.

Revenue by Source

  • Breakdown of your revenue by source represented as a bar graph

Revenue by Medium

  • Breakdown of your revenue by medium represented as a bar graph

Revenue by product category

  • Leaderboard insight listing the product categories that generated the most revenue represented as a tabular insight

Revenue by Product SKU

  • Leaderboard insight listing the product categories that generated the most revenu represented as a tabular insight

Quantity

  • Trending insight of the number of units sold by your storefront in the given time period.
  • Total quantity sold and total revenue are metrics shown in the insight.

Best Selling Days

  • Leaderboard insight of days when your storefront made the most revenue represented as a tabular insight with date and $ amount of revenue.

Mashups

  • Transactions vs Sessions
  • Revenue vs Sessions
  • Revenue vs Transactions

So if you’re in the business of selling, you can have your own Google Analytics ecommerce dashboard!

Track Our Startup: SIX New Projects We’re Working On!

You can get your very own Stripe and PayPal payments dashboard at Dasheroo now! Go check them out if you use these payment solutions for your business, it’s pretty cool to see your these metrics next to your Google Analytics dashboard or your social media dashboard.

Here’s what we’ve been working on for your future Dasheroo business dashboard:

  • Josh submitted our iOS app to Apple and we’re in QA with our Android app. I won’t talk about it again until we launch!
  • Alex has been working on OAuth. This is simply a way for us to easily integrate with a ton of 3rd party applications like the ones you have on your dashboards. This also enables a top-secret integration with Salesforce.com too, more on that soon!
  • Andrew has been working on the “scaffolding” for our agency & partner admin console. If you’re an agency you want some controls over your client’s dashboards and you want to be able to easily log in and out of them from one spot.
  • James has been working on responsive design for our dashboards and Court has been busy in QA with it. This is great for integrations but also enables our dashboards to look nifty on tablets and mobile devices.
  • Competitor Dashboard - Nivi and team have been making great progress on this new dashboard template so that once James (he went to Alaska!) is back, he can assess when we can take the competitor dashboard live. You’ll be able to select this feature right from the dashboard templates to compare how you’re doing with a few metrics to how your competition is doing.
  • Dreamforce - Foo Fighters

    Do you think the Foo Fighters need a business dashboard? We do!

    OK, that’s a ton of stuff in flight!

But Wait There’s More…

We’ve decided to sponsor Dreamforce! Like we said Alex has been working on a super-secret Salesforce project and you’ll get to see it at this amazing annual event. John and Josh will also be speaking on how we did it and show you.

We’ve just had our first request for a non-profit pricing program. We were so successful with it at our last company it makes total sense. Plus we really love helping those who save people, animals and the environment, everyone should huh? Janine is taking on getting this project together since she worked it at VerticalResponse. More on that as it unfolds but it’s slightly complicated.

Back Office

We don’t have a policy for vacations here, pretty cool huh? We just work off of the “Get your sh*t done” policy. So I talked to our legal team this week who blessed a non-policy policy, for now it works for all of us so hopefully it continues to!

John at Dasheroo

P.S. I hate accounting.

What’s Really Important in a Google Analytics Dashboard

At Dasheroo we’re all about looking at our Google Analytics dashboards when we get up in the morning, multiple times during the day and before we go to bed at night. Why? We’re a growing online business and we want a quick snapshot of what’s working and more importantly what isn’t.

So here’s what a portion of our GA Dashboard looks like:

Screenshot of Dasheroo's own Google Analytics Dashboard

Here’s what we like to look at:

Since we do a ton of social media marketing (there’s a dashboard for that) we like to keep an eye on the Social Sources insight to track traffic to the website from our social channels. If you look at the pie chart above you’ll see that Facebook drives a ton of traffic for us which is great but every now and then we get a boost from Twitter, then we can go to ourTwitter Dashboard to see what’s driving the goodness.

We like to see our New and Returning Users insight. We always want to have newbies coming to our site more than returning users. The returning ones we love ALOT but they’re probably coming back to log in. A spike like the one you see just above is even better because that means a whole host of new users came to the site.

The Top Sources By Medium is a great way to track Google’s Channels to see how traffic is coming to your site. The Direct channel is people typing in your URL into the browser while the Organic channel is people searching on a keyword (not paid) and coming to your site. You can see here that there was a huge spike in Organic traffic on July 13. We like to closely monitor that especially since we don’t pay for it!

A screenshot of Dasheroo's Search Traffic on their dashboard.

We also track our internal metrics in a Custom Insight [ SHORT VIDEO]. In this case it’s the total number of people who register for a free business dashboard. We like to put it smack dab in the middle of our Google Analytics Dashboard right next to our Sessions insight. Why? We like to make sure we’re getting around a 10% conversion rate and we are, phew.

Dasheroo's dashboard with custom data.

If we see that there might be something going on with traffic, like maybe we got a new traffic source (or lost an existing one) we compare date ranges on the All Traffic insight. We select a date range or “Last Week” vs. a “30-Day” range and compare where traffic is coming from. In this one you’ll see we got a new source of traffic because LaunchingNext linked to us and included us in an email. Awesome!

Screenshot of Dasheroo dashboard for all traffic sources to your website.So there’s a quick overview of how we use our own Google Analytics dashboards. When we need to dive deeper we go directly into our Google Analytics native account, but this gives us a great starting point to ask questions.

Oh, we’ll be adding even more insights to Dasheroo so check back frequently but don’t worry, we’ll tell ya!

Report: Understanding Mobile Measurement

Attitudes Toward Mobile Marketing Among Client-Side Marketers Worldwide, March 2015 (% of respondents)The great people over at eMarketer are always posting some relevant information about marketing measurement and this was a really informative one all about what marketers understand about how their visitors use mobile. As eMarketer estimates, “Mobile ad spending in the US will jump 50.0% this year to reach $28.72 billion, or 49.0% of digital ad spending.” That’s huge and more of a reason why people should understand how their customers interact with them digitally.

So they dove into this poll by Adobe and Econsultancy in their Quarterly Digital Intelligence Briefing: The Quest for Mobile Excellence to find out just how much marketers know about measuring their mobile spend.

Highlights and Our Take

  • 33% don’t even know what % of their traffic is mobile. Easy to see in Google Analytics
  • 34% said they had ‘a defined mobile strategy that goes out at least 12 months’, down from 36% who agreed with this statement last year. Bummer, this number should never go down.
  • Of those, 30% don’t know the device breakout of their visitors. Easy to see in Google Analytics. See our case study below.
  • 71% say that the desktop website is their top priority when it comes to providing a consistent customer experience, ahead of mobile site (16%), smartphone applications (10%) and tablet apps (3%). We can’t believe that only 16% are considering a mobile site as a top priority considering how easy it is to get one!
  • Dasheroo business dashboard: Google Analytics Device type

    With a simple look at the Dasheroo Sessions By Device Type insight we saw a huge spike in mobile traffic and tracked it back to our Facebook Ads!

    37% don’t understand how people use phones differently than tablets. Increasingly important as you build out your mobile applications.

A Short Dasheroo Case Study: Measuring Mobile Advertising

One component of our launch in May was a series of Facebook Ads across both desktop and mobile. Why not right? More eyeballs = more users! So we started to see a huge spike in traffic, specifically mobile visitors from Facebook. Many of these visitors signed up to use Dasheroo (great!) However overall our conversion after they signed up to interact with our business dashboards application was very low compared to other channels.

What we found was the since our website is optimized for mobile people signed up expecting to have a great customer experience with our application as well. However we do not yet have a mobile application so our current app is optimized for desktop only.

Device type report in Google Analytics

Dear marketers: with a simple Device Type report from Google Analytics we know exactly what order we need to develop our apps in, looks like the Apple iPhone wins!

Mobile users expected to have a great customer experience across the board but they were stopped short when they got to our application.

What did we do? We pulled the Facebook Ads for Mobile until we launch our mobile application.

We continued running the desktop feed and our conversion rates increased immediately. Did we get the traffic we once got? No way but the quality of it was incredibly better.

Lesson learned on mobile measurement.

I’m John Hingley and This is Dasheroo’s Startup Story

That's me, John Hingley, one of 4 very proud Dasheroo co-founders today.

That’s me, John Hingley, one of 4 very proud Dasheroo co-founders today.

John Hingley here, I’ve been around the marketing, e-commerce and sales business for quite a while both full-time and consulting with great businesses. In one of these businesses I was brought in to fill a huge gap the company had, a sales and marketing leader. Although the business ran pretty sophisticated marketing programs - email marketing, Google AdWords, all forms of social media marketing, SEO, content marketing, trade shows, you name it - at this particular time, they weren’t growing as fast as they needed to.

I observed that most of the weekly meetings were those typical ‘status updates’ that often devolve into, well, a waste of time! So I initiated a weekly meeting called the Triple-S. People around the office asked me what it meant. It was simple; Sell Some Sh*t. If you weren’t talking about the metrics driving the business, you weren’t in the meeting.

The format of SSS was a metrics-driven meeting driven off a Google doc. I wanted a place where everyone could put their data in a shared, collaborative environment. A ‘unified view’ of the data if you will. And you know what? It worked! Our lead generation folks got a better understanding of what the landing page optimization people were doing, and the content marketing people started to create content that was more relevant based on the keywords people were coming to the site from. And so on.

But after a few of these, I noticed some faults. About 2 hours before each meeting, I noticed the team scurrying around, gathering the charts and graphs to place in the Google doc. Time suck! Next, there was little transparency in many of the numbers as some of the team would create their own Excel charts from the data of the native app, like Facebook. How did I know if it was accurate? And last, WTF do we all have to wait until Tuesday at 1p to look at all this great stuff?! It should be updated and available to any of us, any time, from anywhere.

So I took a step back, looked at it and asked, why the hell isn’t there a solution for any business that automatically gathers all of this data up to the minute (or hour even!), eliminate human error and display what’s going with the biz RIGHT NOW, not what happened 6 days ago? RIGHT NOW we can affect change, we can’t make up the 5 days we lost if we could have seen the reports now.

We've got Dashboards for all kinds, free!

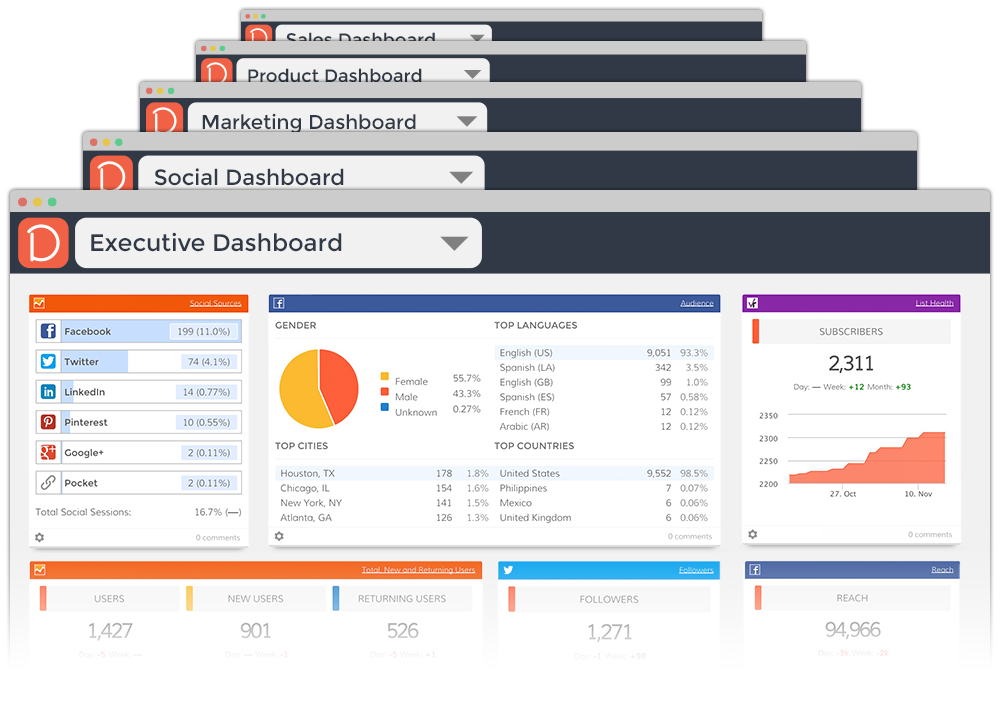
We’ve got Dashboards for all kinds, free!

When I stopped my consulting gig I decided to toy with the idea of starting this new company we lovingly call Dasheroo, and create the best product for businesses that need business dashboards. (Did I mention every business needs a business dashboard?)

Luckily our idea of bringing data together in an easy-to-read format was met with smiling faces of people around me. After a few months James Ryan our amazing VP of Engineering (sold his last company to Get Satisfaction) came on, set up shop in Austin, TX, and we worked to get an alpha version of our product out with 800 users.

We piqued the interest of a venture firm, Cloud Apps Capital Partners, that believes in everything we’re about; delivering productive business apps in a ‘business freemium’ model. Matt Holleran and Judy Loehr have been amazing to work with, they’ve given all of the support we need and more, and the best part is, they’re really, really nice and are part of the Dasheroo family already.

Screen Shot 2015-04-25 at 12.21.09 PMAmazingly, to round out the team this past year we scored Josh Feinberg (VP Product) and Alf Brand (VP Customer Success and UX expert) to join. These guys all have the experience we need to make an awesome product even more awesome.

And now we have the best tool any business can have in their tool chest; all of the important business metrics in their own business dashboards, for free.

How can it be free, you ask? What’s the catch? We know a lot about how to make things for small & mid-size business owners, agencies and even enterprise businesses, being that we’ve always been one ourselves. And we know that you need a break, but you’ll pay for bells and whistles you really need. Plus, I used to run an agency, so I hope other agency types see value in Dasheroo too. So that’s the deal, it’s free, you’ll love all of the functionality you’ll get and when you grow, we grow. Can we shake on that?

So thanks to the 1,700+ amazing beta users who have been banging on Dasheroo for the past few months, telling us what you like and more importantly what you don’t. This product is yours, not ours. It grows with you.

We’ll keep being transparent with you, we’ve always told you 99% of what’s happening behind the scenes, there’s not a chance of stopping that now.

So take us for a spin, we’re ready to grow and grow fast. And if you like us tell your friends. We don’t want to spend our money on advertising, we’d rather give it to you in the form of a stellar product.

Cheers,

John, James, Josh, Alf, Court, Andrew

P.S. Special thanks to the following friends for helping us get to this point:

John Jantsch (Duct Tape Marketing), Viveka Von Rosen (Linked Into Business), Alex Theuma (SaaScribe), Matthew Toren (iSmallBusiness), Adam Toren (Kidpreneurs), Dave Kerpen (Likeable Local), Jay Baer (Convince & Convert), Lauren Simmonds (Small Business Computing), Bryan Eisenberg (Idealspot), Pratik Dholakiya, Tom Taulli, Mark Evans, Steve Strauss (The Self Employed), Carol McManus (LinkedIn Lady), Ken Herron, Emily Crume and Erik Fisher (Social Media Examiner), Anita Campbell (Small Biz Trends), Matt Mansfield (MattAboutBusiness), Ramon Ray (Smart Hustle Magazine) and last but certainly not least Janine Popick.

Our friends and family of amazing investors (who are literally our friends and our family :-)

For the full press release, go here.

Looking at Business Dashboards a New Way - Mashups

We all naturally tend to look at our business metrics in a silo. “What are my website sessions like?” Better go look at Google Analytics. “How many Twitter Followers did I gain last week?” Hop on over to your Twitter account.

Well, as we’re sure you are well aware of, we’re aiming to change all that. First, our business dashboards allow you to look at all your data from your apps, all in one spot. Yup, no more logging into all those various apps, all those tabs to find your data. All your data in one spot. That’s Dasheroo! OK, enough of the self-serving banter. But we really do hope this helps you make more well informed, data driven decisions to grow your biz.

Now, wouldn’t it be cool if you could look at data points from different apps, like Twitter Followers and Facebook Fans, together? You could instantly compare audience growth between the two. Wouldn’t it be great if you could see if your Google Adwords campaigns are also driving not just reported clicks, but also growth in over website sessions? Reese’s! (like peanut butter and chocolate…)

Looking at things this way, you can compare performance between a couple channels, or even see if there’s correlation between them. But if you have to jump back and forth between the two applications, or combine them into a Google Sheet for a custom report, chances are you might not get around to it.

Think about these possibilities:
  • Twitter Followers vs. Facebook Fans - what a great way to compare audience growth!
  • Facebook Likes vs. Twitter ReTweets - this can show you engagement comparison.
  • Facebook Engagement Rate vs. LinkedIn Engagement Rate - instantly compare engagement rate across these two networks. Which one is performing better?
  • Google AdWords Impressions vs. Google Analytics Sessions - wow, maybe your Adwords spend, in addition to driving tracked clicks, is also driving untracked users to your site. That might make your investment in Adwords seem pretty good.
  • Twitter Re-Tweets vs. Google Analytics Social Sessions - See if you social efforts and engagement is driving users to your website.
  • Facebook Reach vs. Google Analytics Sessions - another cool way to see if your social efforts are driving sessions or users to your website.

Here’s a sneak peek (shhhhh;)

Our new business dashboards with mashups!

Our new business dashboard mashups! Coming soon to a screen near you

Now, we need to be careful about the ‘ol correlation vs. causation conundrum, since you may not be able to absolutely prove that one outcome affects the other. But it certainly does give you more insight into how your efforts in one area may complement or help out in another, or if your performance in one social channel is way better than it is in another. Sound good?

We hope so! Because when we officially launch Dasheroo (yup, ripping that ‘beta’ sticker off) on May 5, you’ll get a 1/2 dozen of what we call ‘mashups’, which will give you instant insight into just those metrics.

We hope ya like ’em, and as always you’ll get a chance to tell us about other multi-app Insights…we mean ‘mashups’!

We Decided to Push Our Launch Out a Week…

Using our Mashups you'll be able to compare metrics across applications!

Using our Mashups you’ll be able to compare metrics across applications!

Hey there, Dasheroo here. As you can image we’ve been working our asses off trying to get our official company/product/everything launch out the door for the best business dashboards we can provide. But if you are familiar with all of the twists and turns that software development brings you, you run and run and run and find stuff you need to fix. Which is what happened.

Specifically we wanted to make sure for launch you could compare metrics across different applications. Like Facebook Reach and Google Analytics Sessions; maybe something really cool you did on Facebook had a direct affect on your website traffic Screen Shot 2015-04-23 at 1.24.09 PMresulting in sales. You’d want to see that right? So we’re QA-ing the hell out of it because we didn’t work this hard to launch with a sub-optimal feature for you.

So we’ll restart the countdown to launch and set it for now to 5/5/2015. BTW, did you know we have a countdown widget?


Google Analytics Acquisition Report: where are your B2B leads coming from?

If you’re a B2B marketer, you live for leads. Sure, sales is where the rubber meets the road, but for most of those there’s a little hand-holding and nurturing before the order comes in. Users need to have confidence that the service you offer is really going to knock it outta the park for them. Their experience at these early stages is key in order for them to convert. That’s true know matter where they come from - finding you on organic search, via PPC, or from referral traffic.

Are you tracking the success of your lead gen and conversion sources and success by channel? If so, awesome for you; if not, well start now. Why? Because each channel will typically have pretty big variances in sessions and conversion rates, so understanding your most productive acquisition channels, then drilling into the underlying sources can help you optimize your efforts. Meaning, driving more, and higher converting leads!

So here’s a quick snapshot for the past several weeks of data for Dasheroo:

Google Analytics Acquisition report: Look at that referral conversion rate!

Google Analytics Acquisition report: Look at that referral conversion rate!

Here’s our 5 ‘channels’. In the next week or so, we’ll post more about exactly what each of these channels represent, because it can get a little tricky and deserves its own article. Keep an eye out!

But for now, look at that conversion rate of 8.62% for ‘referral’, yee haw!

Referral traffic is Google’s method of reporting visits that came to your site from 3rd party sites, not organic or paid ads. When someone clicks on a link to go to a new page on a different website, Google Analytics tracks the click as a referral visit to the second site. The originating site is called a “referrer” because it refers traffic from one place to the next.

So whatdya do next? Drill in, of course! Who are these awesome people sending me these obviously very relevant people that seem to really dig Dasheroo business dashboards. Here we go:

Screen Shot 2015-02-22 at 10.54.17 AM

Wow, Duct Tape Marketing sends us a lot of people. Thanks John and team! But just look at that ‘ga_partner_gallery’ source. 36 new users with a whopping 35% conversion rate. Whoa. So what is that? Well, that’s our brand-spanking new listing on the Google Analytics Partners gallery. That just went up a few days ago. OK, these are all great data points, but what do you do with them? Here’s a few ideas:

  • We’ll contact John Jantsch at Duct Tape Marketing, thank him for all those folks he sent over and see if there’s some tweaks we can make to a landing page to make those people convert even higher. And when we start an affiliate program invite him to join.
  • Look at that inc.com traffic AND high conversion. Click on that link and find more detail, in this case 20 of the 21 new users came from just one article. Might wanna publish more articles like that one…
  • Google Analytics Partners…I think you’ve heard of Google. Pretty sizable. May not return our calls. But, Google is sharp and they love to see highly engaged users and valued apps. So a couple takeaways in these cases; first it doesn’t hurt to highlight this and lob a targeted email into the Partners team. Get ‘featured’ and you could generate 100s if not 1,000s of new users. Second, get yerself listed on similar sites and galleries! One of the reasons the Google Anaytics Partners site is working so well is because the audience is already very targeted and predisposed to wanting a product like Dasheroo. So we’re already busily researching and applying for listings on marketplaces that cater to folks that like business metrics - whether it be social media, email marketing, surveys, CRM or other types.

Bottom line, the metrics tell the story, you just have to know where to look, how to interpret them and leverage it for your B2B success. Do it!

Track Our Startup: Instagram Business Dashboards + More!

Instagram business dashboards are live

We’ve got Insights for all of your Instagram metrics!

We released Instagram for your business dashboards and we’re stoked! You’ll get an overview, follower numbers, Likes, comments and more. Go check them out and add them to your dashboards.

We released a few new Insights for your Google Analytics Dashboards, too. You’ll see Social Sources as a line graph and New vs. Returning Users as a pie chart, fun!

Working on Stuff…

We’ve been wrestling with Facebook a bit. Some of their data is returning to us wonky so we needed to fix the Gender graph. Also New Fans are currently one day behind, we’re working on making that an up-to-the-hour update. Sorry about that.

Our email inbox runneth over with new app requests!

Our email inbox runneth over with new app requests!

We’re also working on giving you more of a custom date range feature so you’ll be able to choose date ranges outside of 30 days. Hopefully we’ll slowly roll that feature in the next few weeks.

We’ve been getting more requests for new Apps! We love this so keep ’em coming.

We’ve reached 930 Users and we’re not technically “live” yet, this is awesome. That coupled with over 13,300 Facebook Likes and over 2,500 Twitter followers, we couldn’t be happier. Thanks for all of the social love everybody!

Sheets!

Our dev team is hard at work building out our upcoming Google Sheets integration. This one will be great since there are so many different ways people use Sheets for their business. Can’t wait to get this one live and into your hands since it’s been a very popular feature request.

The whole team has a meeting with a really awesome VC this week, it’s the 2nd one! He’s interested in coming into the round that we’re working on now. We’ve also got some mad love from friends and family so we’re pretty excited about that part too.

Plus, we finally got listed on the Constant Contact Marketplace, and the Google Analytics Partner site and we’re already getting new Users!

New Release: Instagram Business Dashboards are Here!

We’re excited to announce that we’ve just released the #1 MOST REQUESTED APP BY ALL OF OUR USERS; INSTAGRAM BUSINESS DASHBOARDS! Sorry for the brief scream it’s just so supercalifragilistcexpialidocious!

New Instagram business dashboardsWhat do you get?

  • Overview - Total number of Followers, Following and Posts per day (line graph)
  • # of Followers (line graph)
  • # of Following (line graph)
  • # of Posts (line graph)
  • Engagement # of Likes and Comments (line graph)
  • List of 5 highest engagement posts
  • List of 5 most recent posts

Get your Free Dasheroo account (or login) to see it in action!

But wait there’s more…

We were also able to get a few more Insights in there for your viewing pleasure. In your Google Analytics dashboards you can now get a line graph of Social Sources and a pie chart of New and Returning Users. We also intro’d a few new colors into our graphs that make it easier for you to see.

Enhanced Google Analytics business dashboards

There you have it, cheers!