Dasheroo Blog

Business Dashboards Done Right

Sign Up – It's Free!

Search the blog

Recent Posts

  • Dasheroo Data Dashboard: How To Spot Correlations
  • Track Our Startup: Tracking Internal KPIs + Customer Success
  • Startup Lessons - How We Chose To Spend on An Expensive Event
  • How To Manage Data Dashboards for Multiple Clients or Teams in Dasheroo
  • Track Our Startup: We Survived Dreamforce + On To Q4 Growth

Dasheroo Insight Riot

Vote for your favorite apps – and we'll build some Dasheroo Insights for them!

Go Riot!

Categories

  • Billing Dashboard Features
  • Business Dashboard Features
  • Data Dashboard Features
  • Data Visualization
  • Marketing Dashboard Features
  • Sales Dashboard
  • Startup Lessons Learned
  • Uncategorized
  • Weekly Progress
  • Who Charted?

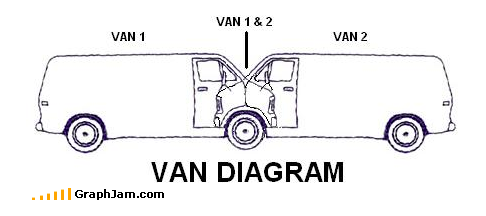
Who Charted? Here’s an Amazing Van Diagram

July 5, 2015 by Dasherooer·0 Comments

Van Diagram - Funny Charts - Dasheroo


Check out all of the funny charts we find here!

Related posts:

Who Charted? Charting the Anatomy of Song Genres Who Charted? Do You Listen to Vinyl? Who Charted? Solutions to Your All of Your Computer Problems Who Charted? Better Bring an Umbrella! Who Charted? Should You Play Your Harmonica?
business dashboards dasheroo funny charts funny graphs Who Charted

Post navigation

Previous Previous post: Dataviz: California’s Drought Report Card
Next Next post: Dasheroo’s Marketing Dashboard Template: Marketing Maven
©2015 Dasheroo