As you know Google Analytics has a ton of reports, many are meaningful but there are just so many you don’t know which ones will work for your business. So this post will focus on the New vs. Returning Users report and how you might be able to use it.
How it works
Google Analytics uses cookies for behavior tracking and those cookies track both the device and the browser. Why is this important? Because it affects the metrics in this report. For instance when a user visits a site from their mobile for the first time they’re considered “new”. But if they go to work and visit the same site that day they’re also considered “new”. And if they clear cookies and visit the site from the same device, they’re considered “new”. Is it perfect? No but it’s certainly directional.
What can you do with it?
You can see by goal how new users act vs. returning users.
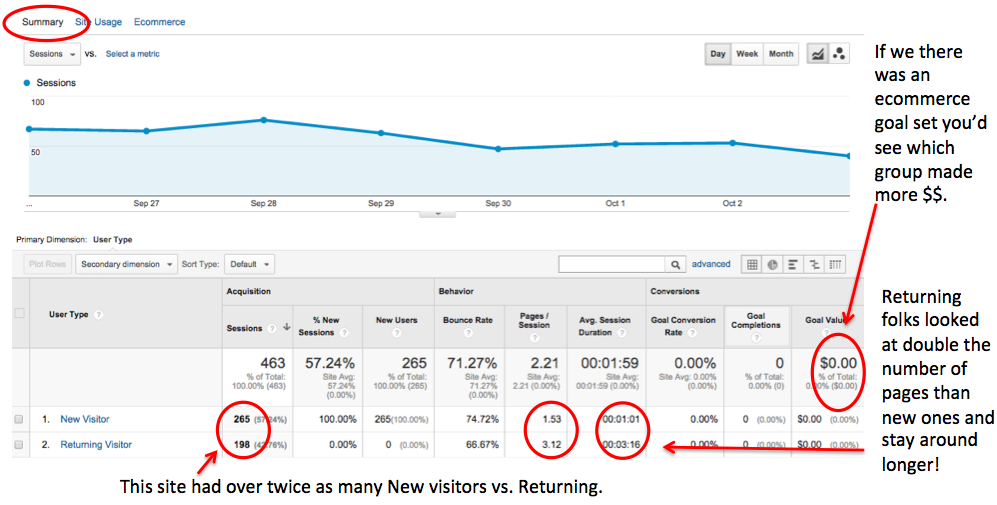
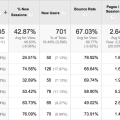
With the report above you can see that Returning users looked at over twice the amount of content and stayed a lot longer than New users. So you might want to do some more retention programs like content-rich email newsletters to get them coming back to the site.
Another thing you can do is to add a Segment to take it one step further and view New vs. Returning by revenue, transactions, mobile and desktop users to really hone in on who you should be targeting.
Google Help suggested going to Geo then Location report and segment by both New Users and Returning Users so we did and here’s what we found:
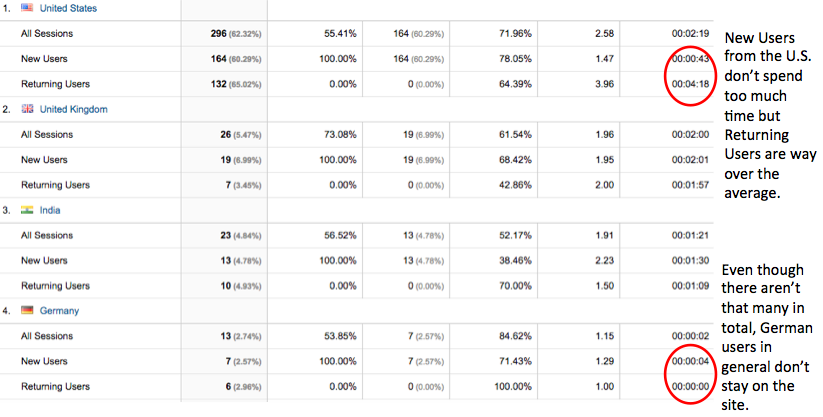
If we wanted to attract more users from Germany we’d probably need to Internationalize the site. We’d also want to spend more time keeping New Users from the U.S. engaged. The more Returning Users we have the better off we are. We might want to dig into the content that the Returning Users are looking at and bring that more to the surface for New Users.
There you have it. Get in there and play!