Dasheroo Blog

Business Dashboards Done Right

Sign Up – It's Free!

Search the blog

Recent Posts

  • Dasheroo Data Dashboard: How To Spot Correlations
  • Track Our Startup: Tracking Internal KPIs + Customer Success
  • Startup Lessons - How We Chose To Spend on An Expensive Event
  • How To Manage Data Dashboards for Multiple Clients or Teams in Dasheroo
  • Track Our Startup: We Survived Dreamforce + On To Q4 Growth

Dasheroo Insight Riot

Vote for your favorite apps – and we'll build some Dasheroo Insights for them!

Go Riot!

Categories

  • Billing Dashboard Features
  • Business Dashboard Features
  • Data Dashboard Features
  • Data Visualization
  • Marketing Dashboard Features
  • Sales Dashboard
  • Startup Lessons Learned
  • Uncategorized
  • Weekly Progress
  • Who Charted?

Dataviz: Why Do City Buses Bunch Up?

June 19, 2015 by Dasherooer·0 Comments

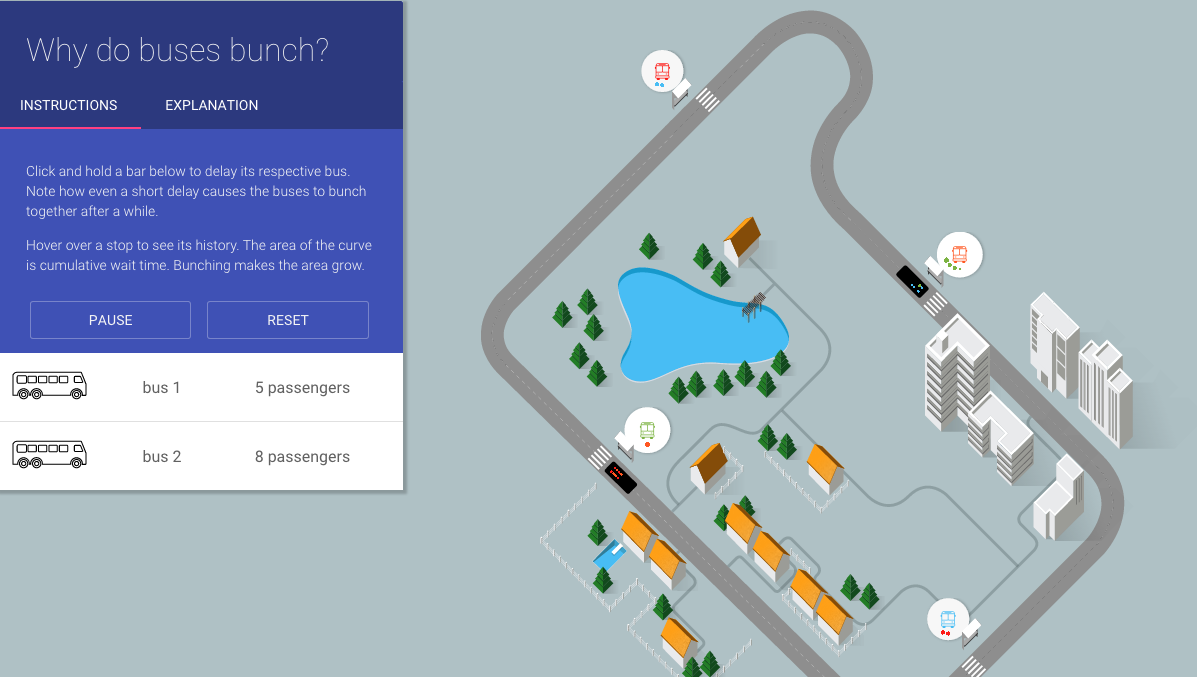
Thanks Flowing Data for bringing us the awesome interactive dataviz from Lewis Lehe, PhD candidate in transportation engineering, that answers a city-dwellers age-old question: why the hell do buses bunch up at a stop?

Simply click fast on one of the buses to show a short delay and you’ll see how the bunching begins.

an interactive dataviz on why buses bunch up at stops

Click here for more awesome dataviz we find on the web!

Related posts:

No related posts.

Post navigation

Previous Previous post: Startup Lessons Learned: Productive Board Meetings
Next Next post: Who Charted? Is It Cool or Not to Be Covered in Tar?
©2015 Dasheroo