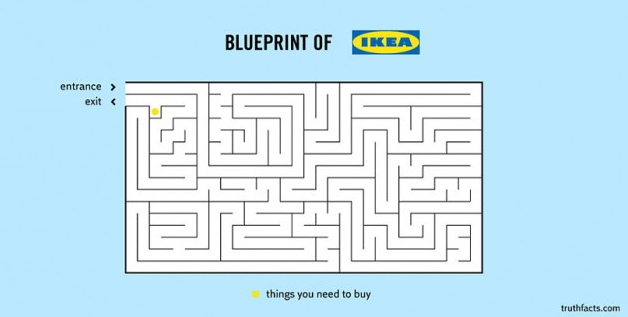
Dasheroo Blog

Business Dashboards Done Right

Sign Up – It's Free!

Search the blog

Recent Posts

  • Google Dashboard: 3 Key Google Analytics Metrics to Track + Why
  • Track Our Startup: Dasheroo for Agencies In December
  • Dasheroo Business Dashboards In The News: SBA and Salesforce IQ
  • Startup Lessons Learned: Establishing Conversion KPIs
  • 3 Important Trends to Spot in a Twitter Analytics Dashboard

Categories

  • Billing Dashboard Features
  • Business Dashboard Features
  • Dasheroo Press
  • Data Dashboard Features
  • Data Visualization
  • Google Dashboard Features
  • KPIs
  • Marketing Dashboard Features
  • Sales Dashboard
  • Social Media Dashboard Features
  • Startup Lessons Learned
  • Uncategorized
  • Weekly Progress
  • Who Charted?

Who Charted? How to Get Around Ikea

November 30, 2014 by John Hingley·0 Comments

Screen Shot 2014-11-25 at 11.54.25 AM

Thanks TruthFacts!

More funny charts we find here.

Related posts:

Who Charted? Are Half the Man? Who Charted? What Do You Call Pizza? Who Charted? What’s Your Dog Really Saying? Who Charted? Do You Listen to Vinyl? Who Charted? Here’s an Amazing Van Diagram
funny charts funny graphs TruthFacts Who Charted

Post navigation

Previous Previous post: Dataviz: How Color Affects Your Biz [Infographic]
Next Next post: Who Says a Holiday Week is Bad for a B2B Business?
©2015 Dasheroo
Get Your Free Dasheroo Dashboard!

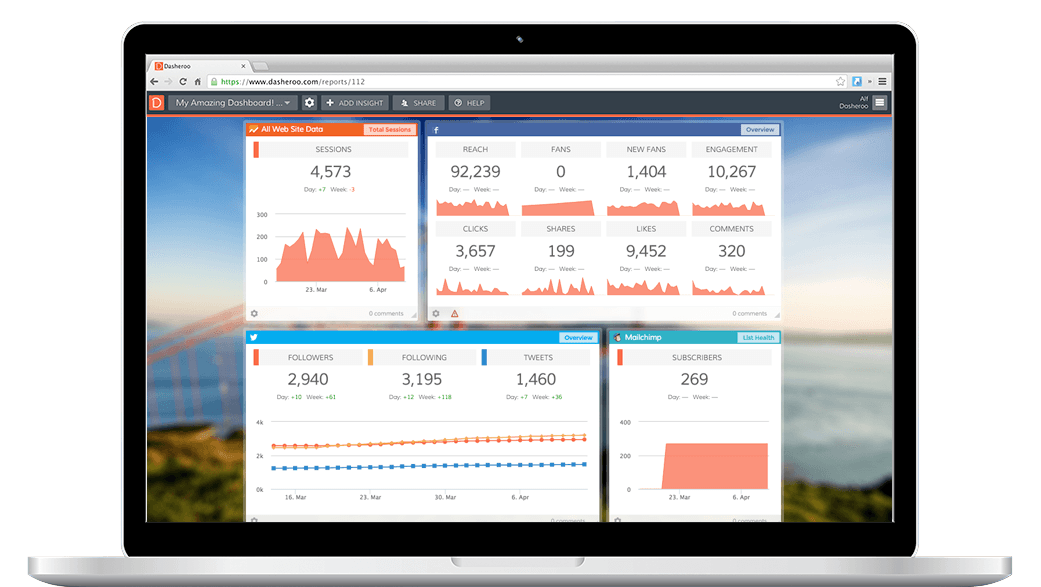
Stay on top of the business analytics from all of your favorite applications. From Google Analytics and Adwords to Social Media and Ecommerce analytics, we’ve got ‘em. Dasheroo is the one stop business dashboard for all of your business analytics.

  • No limited-time trial periods — Dasheroo is FREE!
  • Quick set-up with ready to go dashboard templates
  • No training or complicated implementation
  • Powerful, easy-to-use, and fun!
Dashboard

Sign Up Now – It’s Free!

X