We recently read a great article about graphs, and some great tips for making graphs. Along the lines of a recent post we did about the oft-chided pie chart!
Anyhoo, this is a great, easy read that anyone who lives in the world of data visualization (and isn’t that just about everyone
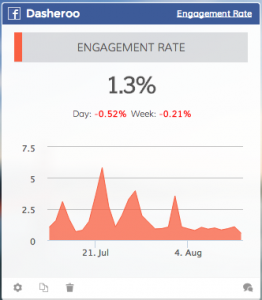
Always provide a label for the Y-Axis, in this chart it’s Engagement Rate
these days?) should peruse. But if you’re short on time, here’s a couple highlights from the 5 takeaways they provide:
1. Label everything! Well, almost everything, but don’t clutter. It’s amazing how many charts do not provide labels for the Y-axis values. Maybe it’s obvious to you, the chart author, but remember your audience needs some context. See the chart to the right: note that the label doesn’t always have to be adjacent to the Y-axis; in this case the label is clearly at the top of the chart.
2. Consider the scale of the values. Sounds obvious, but so many charts have the values set so wide (meaning, say 0-1,000 when the plotted values may only range from 1-250) that it makes it tough to discern variances. The line kinda flattens out instead of clearly showing peaks & valleys, and that’s what you want from a chart! We’ll use the same business dashboard chart as above. If the Y-axis values would have been 0-15, those big peaks would not have been so obvious! We want to do more posts like we did on July 22 where we got a 5.8% Engagement rate.
It gets a little more tricky when you are plotting multiple actions, but that makes it even more important, that if there are going to be large value ranges in your values, to even consider establishing independent Y-values on a left and right side!
This is a taste, go read the whole article!